One major element of the NSF POSE grant for data.table is to create more documentation and testing infrastructure, in order to help expand the data.table ecosystem. This blog post explains what we proposed to do to improve the testing infrastructure.
Current testing infrastructure
Current testing is limited to package checks that run on CI:
- Github actions runs R CMD check on Ubuntu for each PR.
- AppVeyor runs R CMD check on Windows for each PR.
- CodeCov is used to track code coverage for each PR.
- GitLab runs R CMD check on ten different platforms, for each push to master.
New asymptotic performance testing framework
Current performance testing is informal. For example before release devs run test.data.table(memtest=TRUE) to examine how much memory is used during tests. If too much memory is used, then that could result in a check failure on CRAN. Sometimes git bisect is used to find the commit which caused a performance regression. But there are no systematic performance tests that are regularly done, even though performance is a major feature of data.table.
The lack of a performance testing framework to run on CI often results in performance regressions. Because an emphasis in data.table is on handling large data sets, fast and memory-efficient code is essential, and that is a primary reason why people use data.table for their data analyses. Consequently, when new changes introduce performance regressions (for example, increased computation time), users regularly file issues related to performance. As of October 2022, a search for the keyword performance yields 161 closed and 97 open issues and pull requests. Currently, there is no systematic performance testing framework in place for data.table developers, which unfortunately makes it easy to inadvertently introduce changes that adversely affect performance, and this is a barrier to accepting code contributions.
We propose a GitHub Action for comparing the asymptotic performance of a pull request with its parent branch. We, therefore, propose to develop a new infrastructure for systematic empirical asymptotic performance testing, so that data.table developers will be able to easily detect and prevent performance regressions. This will facilitate expanding the data.table ecosystem by making both existing developers and new contributors more confident that their code does not result in performance regressions. We plan to build a solution that uses R package atime, which we created in order to facilitate comparing the empirical asymptotic performance of different R package versions. The main idea is that the user defines some R code that depends on an input data size N, and then atime keeps increasing the data size N until it reaches some time limit, for example, 1 second. Time and memory usage is measured for each data size and R package version, so it is easy to see if there are any significant performance differences. For example, we used atime with git bisect to find the commit which was responsible for the slowdown in a recent issue.
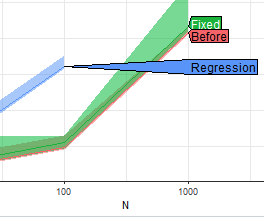
We have previous experience building GitHub actions for continuous integration testing of R packages, via Rperform and RcppDeepState, so we plan to adapt these existing GitHub actions for empirical asymptotic performance testing of data.table. The two people responsible for implementing this part of the project are Doris Amoakohene and Anirban Chetia, who will build (1) an asymptotic performance test suite that formalizes a set of computations for which efficiency is important, and (2) a GitHub action that runs each test in the suite systematically for each development branch, and creates/updates a comment in the corresponding pull request. If there are any significant differences in empirical asymptotic performance measurements, then the comment will contain a figure showing three empirical asymptotic performance curves:
- most recent commit on the development branch,
- the most recent commit on the main branch, and
- the best common ancestor commit (also known as merge base).
The overall result will make it easy for data.table developers to do systematic asymptotic performance testing of each pull request, thereby reducing the chance of performance regressions, and increasing the security/confidence of accepting new code contributions, which will encourage the data.table contributor ecosystem to expand.
New db-benchmark
Because a major feature of data.table is its efficiency (small time and memory requirements), users and developers are interested to know how its performance compares with similar software tools (in R and in other languages). Until 2021, data.table contributor Jan Gorecki maintained the db-benchmark, that compared computation times of various data manipulation libraries on various different tasks. The most recently computed benchmark result from 2021 shows that data.table is among the fastest software. Other similar benchmarks have been created by developers of other libraries such as polars and duckdb.
One of the goals of this project is to get these benchmarks running on a regular basis (every week) on a variety of computing platforms. On one hand, we would like to run benchmarks on Amazon EC2, because that is a public computing resource that anyone can use to verify/reproduce the results. On the other hand, doing all those benchmarks on Amazon EC2 would be prohibitively expensive for most people (the last run was 163 hours, which would cost over $500 per run on a c6i.16xlarge virtual machine with 64 CPUs and 128GB of memory. We, therefore, propose a compromise, where we run the complete set of benchmarks on the NAU Monsoon cluster (which may take over 100 hours, and is free to use for this project, but not reproducible for other groups), and publish them on a web page every week. We will also develop a new db-benchmark-small that can run on Amazon EC2 at a much lower cost (for easy/cheap reproducibility). Our goal will be to have a single Amazon EC2 benchmark run cost $10–$100, which means 3–30 hours of computation time on c6i.16xlarge virtual machines. The result of this project activity will be a new infrastructure for regularly comparing the performance of data.table with similar software libraries, which will be useful for identifying areas where data.table has advantages or could be improved.
Continuous reverse dependency checking on NAU Monsoon cluster
Reverse dependencies are other R packages that require functionality from data.table (over a thousand R packages). A new version of data.table released to CRAN must be compatible with the example and test code in these reverse dependencies. Therefore, before submitting an update to CRAN, each reverse dependency must be checked to ensure that there are no new errors. This involves significant computation time, to run the example/test code in thousands of R packages, and also significant developer time, to investigate any regressions. During this project, we, therefore, propose to create a new infrastructure for continuous reverse dependency checking. In detail, we plan to run regular nightly checks of the data.table main branch on the NAU Monsoon cluster, which is freely available for use by the PI for this project. The results of the checks will be compared with the current check results from the previous release version of data.table on CRAN, and any regressions will be highlighted on a web page for easy identification by data.table developers. Overall the result will be a new shared infrastructure for continuous reverse dependency checking, which will make it much easier for the data.table project to provide more frequent releases.
Actually, this part of the project is almost complete. We have implemented a system on NAU Monsoon which begins a new check every morning just after midnight, and publishes the results to a web page, usually before noon on the same day. There are currently 1400+ revdeps, which would take about two weeks to check, if we run each revdep in sequence on a single CPU. Luckily, we get the results on Monsoon in just a few hours, which is approximately a 30x speedup. A recent result is shown below,
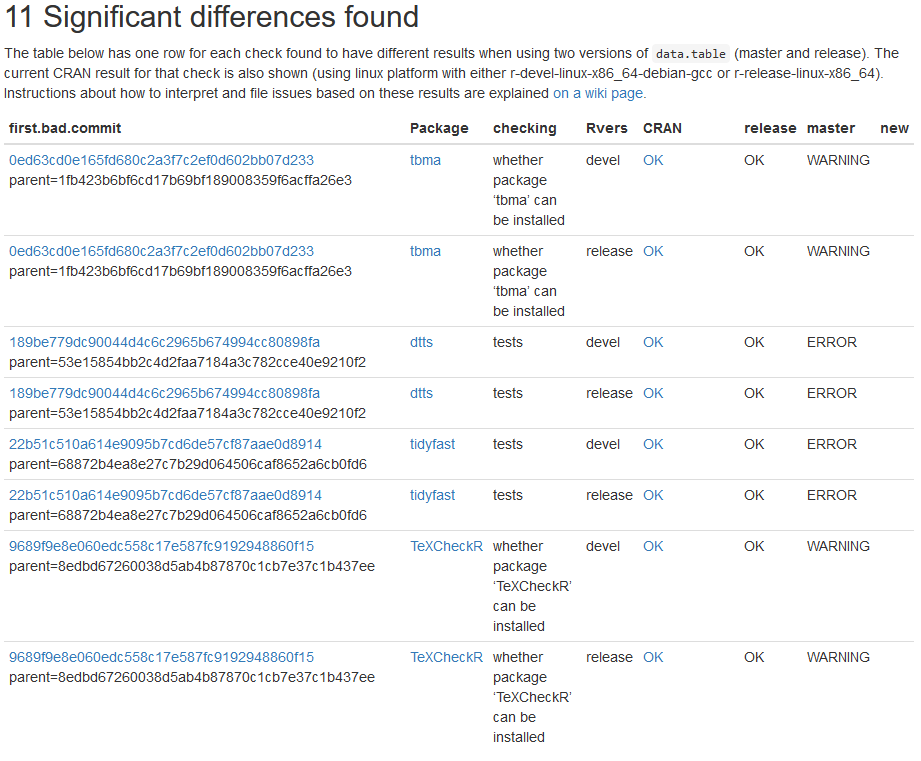
The main result is the table above, which has a row for each significant difference found, when comparing a revdep check using data.table CRAN release, to current data.table master. The Rvers column indicates the version of base R which was used (devel or release), and typical revdep issues show up using both versions of base R. The table is sorted by the first column, which is the SHA1 hash of the first commit which was found to have the issue, according to git bisect. The links lead to the corresponding commit on github (first.bad.commit), the full revdep check log file (Package), and current CRAN check result (CRAN).
The revdep check system has been working for over a year now, and has been very helpful in preparing the upcoming release of data.table 1.15.0 (which had several dozen revdep issues that needed to be fixed). There are currently some package installation issues which may cause some false negatives (real revdep issues which are not reported), but at least these installation issues are displayed on the result web page, and we are currently working to resolve them. The source code for the revdep check system is available in the tdhock/data.table-revdeps repository on GitHub.
Conclusion
We have discussed the plan for augmenting the testing infrastructure available for data.table (performance testing, benchmarking, and revdep checking). Hopefully the new testing infrastructure will allow contributors to be more confident about merging PRs with bug fixes and new features.