library(data.table)
library(dtplyr)
library(dplyr, warn.conflicts = FALSE)dtplyr

Author(s): Hadley Wickham, Maximilian Girlich, Mark Fairbanks, Ryan Dickerson, Posit Software PBC
Maintainer: Hadley Wickham (hadley@posit.co)
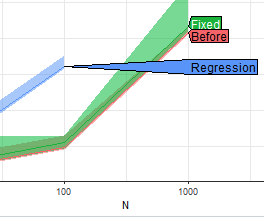
Provides a data.table backend for dplyr. The goal of dtplyr is to allow you to write dplyr code that is automatically translated to the equivalent, but usually much faster, data.table code.
Relationship with data.table
dtplyr is a bridge for users who are more comfortable with the dplyr syntax, but who want to take advantage of the speed and efficiency benefits of data.table. This package exactly duplicates the core functions of dplyr, but replaces the back-end source code (originally in Base R) with data.table operations.
Overview
Excerpted from the dtplyr vignette
To use dtplyr, you must at least load dtplyr and dplyr. You may also want to load data.table so you can access the other goodies that it provides:
Then use lazy_dt() to create a “lazy” data.table object that tracks the operations performed on it.
mtcars2 <- lazy_dt(mtcars)You can preview the transformation (including the generated data.table code) by printing the result:
mtcars2 %>%
  filter(wt < 5) %>%
  mutate(l100k = 235.21 / mpg) %>% # liters / 100 km
  group_by(cyl) %>%
  summarise(l100k = mean(l100k))
Source: local data table [3 x 2]
Call: `_DT1`[wt < 5][, `:=`(l100k = 235.21/mpg)][, .(l100k = mean(l100k)),
keyby = .(cyl)]
cyl l100k
<dbl> <dbl>
1 4 9.05
2 6 12.0
3 8 14.9
# Use as.data.table()/as.data.frame()/as_tibble() to access resultsBut generally you should reserve this only for debugging, and use as.data.table(), as.data.frame(), or as_tibble() to indicate that you’re done with the transformation and want to access the results:
mtcars2 %>%
  filter(wt < 5) %>%
  mutate(l100k = 235.21 / mpg) %>% # liters / 100 km
  group_by(cyl) %>%
  summarise(l100k = mean(l100k)) %>%
  as_tibble()
# A tibble: 3 × 2
cyl l100k
<dbl> <dbl>
1 4 9.05
2 6 12.0
3 8 14.9 


Seal of Approval: nc
seal of approval
extension package
Seal of Approval: tidyfast
seal of approval
bridge package

Announcement: The ‘Seal of Approval’
announcements
grant
community
seal of approval


Announcement: The data.table Ambassadors Travel Grant
announcements
grant
funding opportunity

No matching items