library(atime)
library(ggplot2)
library(data.table)

tdir <- tempfile()
dir.create(tdir)
git2r::clone("https://github.com/Rdatatable/data.table", tdir ) Since August 2023, I have been working on performance testing, which could be useful for expanding the open-source ecosystem around data.table package in R. This could increase confidence in code contributions by ensuring the sustained efficiency of the data.table package.
In data.table, the term “performance regression” refers to a change to the data.table source code, or to the core R build, that causes an increase in either time metrics and memory metrics.
It is important that we prevent significant performance regression from reaching the current release of the data.table package. Slowness or big memory usage can be frustrating; and in fact, are the issues data.table is most used to solve. Any performance regression that makes it into a version release will degrade user experience.
In this blog post, I will demonstrate the use of benchmarking techniques to verify whether reported issues on data.table have been successfully resolved.
Overview
Understanding performance in data.table
data.table is an extension of R’s data.frame, designed to handle large datasets efficiently. It provides a syntax that is both concise and expressive, allowing users to perform complex data manipulations with ease. Its efficiency is particularly evident when dealing with tasks like filtering, grouping, aggregating, and joining data.
The development team behind data.table is committed to continuously improving its performance. Over the years, several major version changes have been introduced, aiming to enhance speed and efficiency. These changes include algorithmic optimizations, memory management improvements, and enhancements to parallel processing capabilities. Upgrading to the latest version ensures that users can leverage the most recent performance enhancements.
Why do we run performance tests on GitHub commits?
Running performance tests on GitHub commits helps maintain a high-performance standard for the package, detect and fix performance regressions, optimize code, validate performance improvements, ensure consistent performance over time and to encourage confidence in code contributions from new people.
It is an essential practice to deliver a performant and reliable package to end-users.
Benchmarking for performance evaluation
To evaluate data.table performance, it is essential to employ benchmarking methodologies. The approach I used utilizes the atime_versions function from the atime package, which measures the actual execution time of specific operations. This function allows for accurate comparisons between different versions of the data.table package, by benchmarking against time and memory usage and giving a graphical visualization of the results.
Details of the performance tests
The primary function atime_versions has six main arguments:
pkg.path: This argument specifies the location on your system where you have stored a git clone of thedata.tablepackage.pkg.edit.fun: The default behavior of pkg.edit.fun is designed to work with Rcpp packages and involves replacing instances of “PKG” with “PKG.SHA” in the package code. Any occurrences of the string “PKG” within the package code will be replaced with “PKG.SHA”, where “SHA” represents the commit SHA/ids associated with the version being installed.N: This argument determines the number of iterations for the benchmarking process. It is a sequence of numbers that define different data sizes to test the performance of the operation.setup: This section contains the setup code for generating the dataset used in the benchmarking process, the setup is determined by the value ofN.expr: This section contains the expression that represents the operation being benchmarked. It uses thedata.table::[.data.table`` syntax to perform the operation on the dataset.
In the given syntax data.table::`[.data.table`, the first part data.table:: installs and loads different versions of the data.table package based on the specified commit ids. Hence, data.table:: will be translated to data.table.SHA1:: for some version hash SHA1. Following that, the expression specified within `[.data.table `` is executed on each installed version. This process is repeated for all the specified commit IDs in the code.
For example:
data.table.ec1259af1bf13fc0c96a1d3f9e84d55d8106a9a4:::`[.data.table`(DT, , .(v3=mean(v3, na.rm=TRUE)), by=id3, verbose=TRUE)In this example, the expression [.data.table is executed on the DT dataset using the specified commit ID (ec1259af1bf13fc0c96a1d3f9e84d55d8106a9a4) of the data.table package. The expression calculates the mean of the v3 column (ignoring missing values) grouped by id3, and the verbose=TRUE argument enables verbose output during the operation. This process is typically repeated for all commit IDs in your code to compare the performance of different versions of the data.table package.
...: This specifies the different versions of the data.table packages that will be tested. It includes three versions: “Before,” “Regression,” and “Fixed.” Each version is associated with a specific commit id.
Test procedure
We run the full performance regression with atime:
- Before the change causing performance regression is made (Before)
- When the change causing performance regression is first submitted (Regression)
- After the Pull Request (PR) which fixes the performance regression (Fixed)
Overall workflow
When a fixing Pull Request is submitted, our procedure automatically takes the following steps:
Pass the hashes for different branches (Before, Regression, Fix) to
atime_versions; along with various parameters for the test (number of simulations, code expression to run, etc.).Use the
atime_versionsfunction to measure time and memory usage across different versions.Generate a plot to showcase the test results, using the
atimepackage built in plotting functions.Display the plot and test results as a comment on the submitted Pull Request.
Here is an example of how to perform the atime test. More documentation of the atime package can be found here.
Example
The first example we will show is an issue reported on performing group computations, specifically when running R’s C eval: link to GitHub Issue that reported regression. This regression was caused by the inclusion of the certain code within the #if block. This PR discusses the specific C code in q7 and q8 in the “db-benchmark” which causes the regression.
This PR fixed the regression problem.
The details of the code problems and solutions are not required for the example; we link them only to share a map of the regression-and-fix process.
To produce performance test results, we first load package dependencies, as well as the current GitHub snapshot of data.table in development:
Next, we establish our performance test. Here, we will create a data.table object and then compute the range by group. We vary the size of the object by varying values of N across tests.
d <- data.table(
      id3 = sample(c(seq.int(N*0.9), sample(N*0.9, N*0.1, TRUE))),
      v1 = sample(5L, N, TRUE),
      v2 = sample(5L, N, TRUE)
      )

data.table:::`[.data.table`(d, , (max(v1)-min(v2)), by = id3)
This setup and expression is then passed to atime_versions, along with a bit of package management information, and hashes (a.k.a. “Commit ID” or “SHA”) for the commits before, during, and after the performance regression.
atime.list.4200 <- atime::atime_versions(
  pkg.path = tdir,
  pkg.edit.fun = pkg.edit.fun,
  N = 10^seq(1,20),
  setup = {
    set.seed(108)
    d <- data.table(
      id3 = sample(c(seq.int(N*0.9), sample(N*0.9, N*0.1, TRUE))),
      v1 = sample(5L, N, TRUE),
      v2 = sample(5L, N, TRUE))
  },
  expr = data.table:::`[.data.table`(d, , (max(v1)-min(v2)), by = id3),
  "Before" = "793f8545c363d222de18ac892bc7abb80154e724", # commit hash in PR prior to regression
  "Regression" = "c152ced0e5799acee1589910c69c1a2c6586b95d", # commit hash in PR causing regression
  "Fixed" = "f750448a2efcd258b3aba57136ee6a95ce56b302" # commit hash in PR that fixes the regression
)
Note
The function pkg.edit.fun that is passed to atime_versions above is a custom function written to manage the packages and paths on the server running this test.
You can see the code below if you wish.
Code
pkg.edit.fun=function(old.Package, new.Package, sha, new.pkg.path){
      pkg_find_replace <- function(glob, FIND, REPLACE){
        atime::glob_find_replace(file.path(new.pkg.path, glob), FIND, REPLACE)
      }
      Package_regex <- gsub(".", "_?", old.Package, fixed=TRUE)
      Package_ <- gsub(".", "_", old.Package, fixed=TRUE)
      new.Package_ <- paste0(Package_, "_", sha)
      pkg_find_replace(
        "DESCRIPTION",
        paste0("Package:\\s+", old.Package),
        paste("Package:", new.Package))
      pkg_find_replace(
        file.path("src","Makevars.*in"),
        Package_regex,
        new.Package_)
      pkg_find_replace(
        file.path("R", "onLoad.R"),
        Package_regex,
        new.Package_)
      pkg_find_replace(
        file.path("R", "onLoad.R"),
        sprintf('packageVersion\\("%s"\\)', old.Package),
        sprintf('packageVersion\\("%s"\\)', new.Package))
      pkg_find_replace(
        file.path("src", "init.c"),
        paste0("R_init_", Package_regex),
        paste0("R_init_", gsub("[.]", "_", new.Package_)))
      pkg_find_replace(
        "NAMESPACE",
        sprintf('useDynLib\\("?%s"?', Package_regex),
        paste0('useDynLib(', new.Package_))
    }
Results
The atime package uses the results of the performance test to create the following plot:
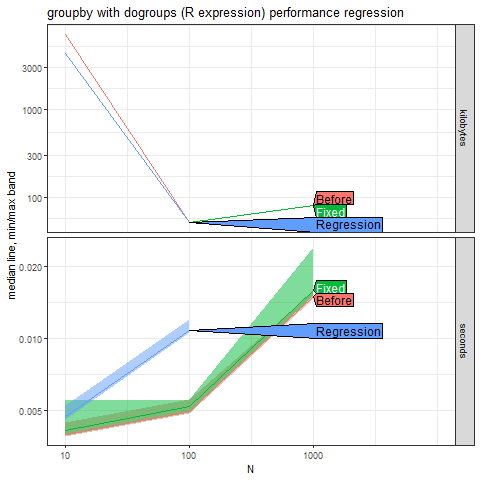
The graph compares the time required to execute the operation before, during, and after fixing a regression issue. The x-axis (N) represents the size of the data on a logarithmic scale. The y-axis represents the median time in milliseconds (logarithmic scale).
Lines:
“Before”: Indicates performance before fixing the regression; we hope to achieve this performance after fixing.
“Regression”: Represents an ideal or target performance level.
“Fixed”: Shows improved performance after fixing.
In the graph, as data size (N) increases, there’s an initial increase in median time, but after addressing the regression issue, there is a significant reduction in the median time, indicating improved performance (fix). The regression issue was successfully addressed.
Automated testing with Github Actions
As part of the data.table ecosystem project, Anirban Chetia has implemented a GitHub Action to automatically run performance tests any time the data.table repository is Pull Requested. This action runs the atime performance test and generates plots of the results in a comment within the pull request. See an example in this pull request.
This action allows the package maintainers to easily determine if a Pull Request has any impact on the time or memory usage of the build for the data.table package. To learn more you can visit Anirban’s documentation or this ReadMe about the atime package
Conclusion
In this blog post, we have delved into the use of the atime package to compare the asymptotic time and memory usage of different development versions of the data.table package. Specifically, we visualized the comparisons between the “Before,” “Regression,” and “Fixed” versions for a specific performance regression issue.
By employing benchmarking methodologies like atime, we gain valuable insights into the performance characteristics of proposed updates to the data.table package. This allowed us to identify and address performance regressions, ensuring that each new version of the package has indeed solved the particular issue reported.
For more examples or practice with atime and regression, you can visit this link and the corresponding fix PR here.


Seal of Approval: dtplyr
seal of approval
bridge package
Seal of Approval: nc
seal of approval
extension package
Seal of Approval: tidyfast
seal of approval
bridge package

Announcement: The ‘Seal of Approval’
announcements
grant
community
seal of approval


Announcement: The data.table Ambassadors Travel Grant
announcements
grant
funding opportunity
No matching items