Two roads diverged in a wood and I, I took the one less traveled by, and that has made all the difference.
A little-known historical tidbit is that Robert Frost’s The Road Less Traveled - so often cited as a celebration of individuality and difficult choices - was in fact meant as a joke to tease an indecisive friend. Frost’s intent was to be ironic; to make fun of someone who is overly dramatic looking back on their choices. Come on buddy, he says, just pick a path - they are both beautiful and will get you somewhere interesting.

I bring this up because, like in the poem, I believe we in the R community often overdramatize moments of divergence between different R dialects, packages, and syntaxes.
And I, like poor Robert Frost, also feel there may be some misunderstanding around my intent here.
So to make sure my opinions are loud and clear, we’ll get some help from this cartoon lady to shout out the things I most want y’all to hear from me:

I have a lot of opinions about R!
This blog post is my attempt to dispel the myths surrounding the relationship between data.table and the tidyverse, and to explain why I believe deeply in both.
“Two roads diverged in a yellow wood, and sorry I could not travel both…”
A bit of history to kick us off. (I know, I know, I’ll keep it short.)
The first official 1.0 version of R was released February 29, 2000, and if I had to guess, I’d bet the first add-on package was created the next day. The beating heart of R is the base language, that the R Core Team has lovingly and diligently maintained for over 4 decades - but its soul, if you will, is the incredible collection of packages that expand and adapt this core.
data.table was released in 2008 by Matt Dowle. (See this video for a very cool recap of the inspiration and process from Matt himself!) Since then, it has grown enormously in scope, contributors, user base, and dependencies.
In 2014, dplyr was released by Hadley Wickham, the birth of what we now know as the tidyverse.
This meant that users now had several options to pick from if they wanted to, say, calculate means by group:
## Base R
aggregate(bill_length_mm ~ species, data = penguins, mean)
## data.table
penguins_dt <- data.table(penguins)
penguins_dt[, .(mean_bill=mean(bill_length_mm)), by=species]## dplyr
penguins %>%
group_by(species) %>%
summarize(mean_bill = mean(bill_length_mm))
data.table is not technically Base R!
It is true that the data.table syntax most closely mimics that of Base R data frames, and deliberately so. However, data.table is an open-source package like any other. Nobody - and I mean nobody - uses only Base R in their work. What a silly culture that would be, if we have all the beautiful multiverse of an open-source language, and we limit ourselves only to the core functionality!

“… looked down one as far as I could … then took the other, just as fair…”
So: We have multiple dialects. How to choose which one to use?
There is no single right answer to that question; it’s all a matter of individual preference and use case. What do you, as the programmer, value most? Brevity of code? Readability of code? Speed? Familiarity? Consistency with collaborators? Availability of learning resources?
I could go on - there are infinitely many reasons, from the personal to the professional to the practical, to choose one path or the other. Sometimes, the answer is as simple as, “This is the way that I know how to do it.”
I can’t tell you how to pick what works for you.

“Dialect” or syntax choices in R are contextual and case-by-case, not lifetime commitments!
The idea of “loyalty” to a package is nonsense. A package is a tool. You might have admiration, respect, or even loyalty to a package developer; you might even therefore trust that it’s worth your time and energy to follow their recommendations.
But if you start feeling bad when you sprinkle a little Base R into your tidy workflow… if you are ashamed for piping a data.table object into ggplot… well that’s getting us nowhere, is it? We are blessed with an overabundance of useful tools and we shouldn’t be limiting ourselves!
## Great news!  This is not illegal!

penguins %>%
  data.table() %>%
  .[, .(mean_bill=mean(bill_length_mm)), by=species]
We all use our own favorite collection of packages, in the combinations that work for us. It might be fun to discuss and learn about new options or new preferences, but no more purity culture, please!

It’s okay to use different syntaxes and package styles all in one workflow!
“…I shall be telling this with a sigh, somewhere ages and ages hence…”
It has come to the point where I can’t avoid mentioning what mainly motivated this blog post: The Great Twitter War of 2018. (Please read that sentence with every ounce of irony you have in you).
Briefly for those who weren’t “lucky” enough to be in the tweetstorm: Sometime around 2018, the #rstats Twitter community exploded into a debate about the relative merits of the tidyverse, data.table, and Base R.
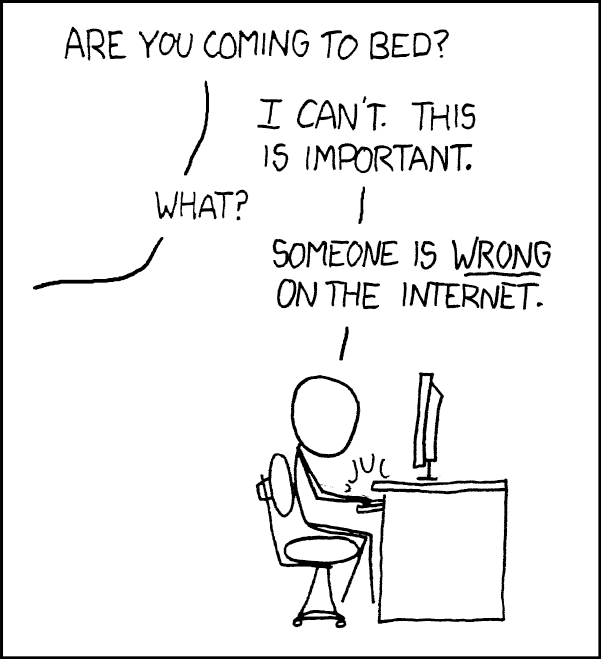
It’s sad to me that the community seems to remember this time as a fight, because so much of that conversation was productive and interesting. Educators shared their experiences teaching with different dialects. Developers talked about the speed trade-offs of the various options. New users were excited to be exposed to information about their options.
But - as seems to be the norm on the internet - a vocal subset of this conversation took the form of an “us vs. them” debate, and weird lines were drawn between data.table/Base R and the tidyverse.

It’s important to note that the primary developers themselves - Hadley Wickham and Matt Dowle - were not the cause of the drama. In fact, this good conversations from this Twitter whirlwind lead to the creation of one of my favorite packages, dtplyr!
So why am I partially digging up a buried hatchet?
Because sadly, even today, I sometimes run into vitriol when I post on social media about data.table or the tidyverse, and I know I’m not alone in this.
Even today, I have my college students asking me about the rift in the R world, and if they have to “choose a side” to learn R.
And most relevant to this blog - I have gotten a lot of questions about why I am involved in a data.table project, since I’m “supposed” to be Team Tidyverse.
Therefore, to be ultra clear:

This grant is NOT about helping data.table “beat” dplyr.
This could not be further from the truth! I’m a tidyverse girlie - from my dplyr earrings to my hex fabric shirts - and I am also a data.table girlie. I, personally, would not be working on this project if I thought anyone involved viewed it as anti-tidyverse in any way.
What we want is the same thing any open-source fan wants:
We want users to be aware of the many fantastic tools, including
data.table, that exist in the R world.We want developers to be inspired to build new and exciting packages, that stand on the shoulders of giants like
data.table, thetidyverse, and so many others.We want beloved packages like
data.tableto stick around long term, and to grow and evolve with R and the R community.
“… and that has made all the difference.”
So, where are we going from here, as a community? Only good places, I think, no matter which path we take in the yellow wood!
I am so excited about this project and about the NSF-POSE grant - both for the longevity of data.table, and for everything we are learning about open-source ecosystems and how to sustain them.

I love the #rstats community!!! Let’s do cool stuff together.
Addendum
Want to hear me rant more about the R community, multiple dialects/languages, and this grant project? I’ll be speaking on these topics at UseR!2024, JSM, and Posit::conf - or you can always find me on BlueSky or Fosstodon!
