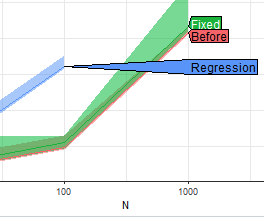
code = "
  int nx = LENGTH(x);
  double *y = (double*)(
    LOGICAL(r_alloc)[0] ?
      R_alloc(nx, sizeof(*y)) : // allocated by R's C
      malloc(nx * sizeof(*y))   // allocated by C
  );
  double *xp = REAL(x);
  // populate y
  for (int i=0; i<nx; i++)
    y[i] = xp[i];
  // do something with y
  for (int i=1; i<nx; i++)
    y[i] = y[i-1]+y[i];
  // sum double array to ensure compiler wont optimize it away
  double sum = 0.0;
  for (int i=0; i<nx; i++)
    sum += y[i];
  SEXP res = PROTECT(Rf_allocVector(REALSXP, 1));
  REAL(res)[0] = sum;
  if (!LOGICAL(r_alloc)[0])
    free(y);
  UNPROTECT(1);
  return res;
"
funx = inline::cfunction(signature(x="numeric", r_alloc="logical"), code, language="C")
set.seed(108)
x = rnorm(1e8)Benchmarking memory usage in R
Profiling memory in R has never been a trivial task.
In this post, I would like to emphasize that currently popular methods are quite inaccurate and should therefore be used with caution. More importantly, they should not be used for drawing conclusions about the actual memory usage of R functions.
The root cause of the inaccuracy with many memory profiling tools in R is that they measure memory allocated by R (including R’s C code). They do not take into account memory allocated using C.
Memory allocation in R
Following example should make it very clear.
Below R chunk is the content of memtest.R file.
Check equal
First, we will ensure that the results are the same, regardless of whether we allocate temporary working memory using R or C:
Rscript -e 'source("memtest.R"); funx(x, r_alloc=TRUE)'
#[1] 1.160649e+12
Rscript -e 'source("memtest.R"); funx(x, r_alloc=FALSE)'
#[1] 1.160649e+12
Memory benchmark using bench
Next, we will use the currently most popular package for profiling memory, bench:
Rscript -e 'source("memtest.R"); bench::mark(funx(x, r_alloc=TRUE))'
## A tibble: 1 × 13
#  expression      min median `itr/sec` mem_alloc `gc/sec` n_itr  n_gc total_time
#  <bch:expr>    <bch> <bch:>     <dbl> <bch:byt>    <dbl> <int> <dbl>   <bch:tm>
#1 funx(x, r_al… 577ms  577ms      1.73     763MB     1.73     1     1      577ms
Rscript -e 'source("memtest.R"); bench::mark(funx(x, r_alloc=FALSE))'
## A tibble: 1 × 13
#  expression      min median `itr/sec` mem_alloc `gc/sec` n_itr  n_gc total_time
#  <bch:expr>    <bch> <bch:>     <dbl> <bch:byt>    <dbl> <int> <dbl>   <bch:tm>
#1 funx(x, r_al… 589ms  589ms      1.70        0B        0     1     0      589ms
As we can see in the output of mark function, mem_alloc is reported to be 0B when we use malloc, while for R_alloc it reports 763MB. The difference we observe here should serve as a warning. It is because bench::mark tracks memory allocations managed by R’s memory allocator and doesn’t inherently account for memory allocated directly through C functions like malloc or calloc. If one intends to use the mark function to draw conclusions about memory usage, it’s crucial to also examine the source code of the function being benchmarked.
It is worth to note that ?mark explains this issue:
mem_alloc-bench_bytesTotal amount of memory allocated by R while running the expression. Memory allocated outside the R heap, e.g. bymalloc()ornewdirectly is not tracked, take care to avoid misinterpreting the results if running code that may do this.
Unfortunately, people are not aware of it and often publish memory usage benchmarks believing they are accurate.
Memory benchmark using cgmemtime
Lastly, we will use an external process to measure memory, cgmemtime, proposed by Matt Dowle in 2014 during his work on 2B rows data.frame grouping benchmark.
cgmemtimemeasures the high-water RSS+CACHE memory usage of a process and its descendant processes.
./cgmemtime Rscript -e 'source("memtest.R"); funx(x, r_alloc=TRUE)'
#child_RSS_high:    1641808 KiB
#group_mem_high:    1626264 KiB
./cgmemtime Rscript -e 'source("memtest.R"); funx(x, r_alloc=FALSE)'
#child_RSS_high:    1641096 KiB
#group_mem_high:    1625820 KiB
While cgmemtime will report very accurate memory usage statistics, it cannot directly measure the memory usage of an individual function call in isolation as it tracks the memory footprint of the entire process (and its child processes).
To estimate the memory usage of the funx() call in this simple example, we can first measure the R process without calling funx().
./cgmemtime Rscript -e 'source("memtest.R");'
#child_RSS_high:     860884 KiB
#group_mem_high:     843844 KiB
And then subtract this baseline from the memory usage when funx() is executed:
(1641096-860884)/1024
#[1] 761.9258
Thank you
I hope this post will help people to be a bit more skeptical when reading R’s memory benchmarks.
R version 4.5.0 (2025-04-11)
Platform: x86_64-redhat-linux-gnu
Running under: Fedora Linux 42 (Workstation Edition)

Matrix products: default
BLAS/LAPACK: FlexiBLAS OPENBLAS-OPENMP;  LAPACK version 3.12.0

locale:
 [1] LC_CTYPE=en_US.UTF-8       LC_NUMERIC=C
 [3] LC_TIME=en_US.UTF-8        LC_COLLATE=en_US.UTF-8
 [5] LC_MONETARY=en_US.UTF-8    LC_MESSAGES=en_US.UTF-8
 [7] LC_PAPER=en_US.UTF-8       LC_NAME=C
 [9] LC_ADDRESS=C               LC_TELEPHONE=C
[11] LC_MEASUREMENT=en_US.UTF-8 LC_IDENTIFICATION=C

attached base packages:
[1] stats     graphics  grDevices utils     datasets  methods   base

other attached packages:
[1] bench_1.1.4   inline_0.3.21

loaded via a namespace (and not attached):
[1] compiler_4.5.0  cli_3.6.4       pillar_1.10.2   glue_1.8.0
[5] vctrs_0.6.5 lifecycle_1.0.4 rlang_1.1.6 


Seal of Approval: dtplyr
seal of approval
bridge package

Seal of Approval: nc
seal of approval
extension package

Seal of Approval: tidyfast
seal of approval
bridge package

Announcement: The ‘Seal of Approval’
announcements
grant
community
seal of approval


Announcement: The data.table Ambassadors Travel Grant
announcements
grant
funding opportunity

No matching items