Thanks to everyone who helped create, shared, or filled out the first data.table survey! The survey was officially open between October 17 and December 1 and it received 391 responses during this time.
This post provides a partial summary of the results. It covers all close-ended questions & includes short, informal summaries of the answers to some of the open-ended questions.
I encourage you to explore the data yourself - you can find it here.
Respondents
A typical respondent was:
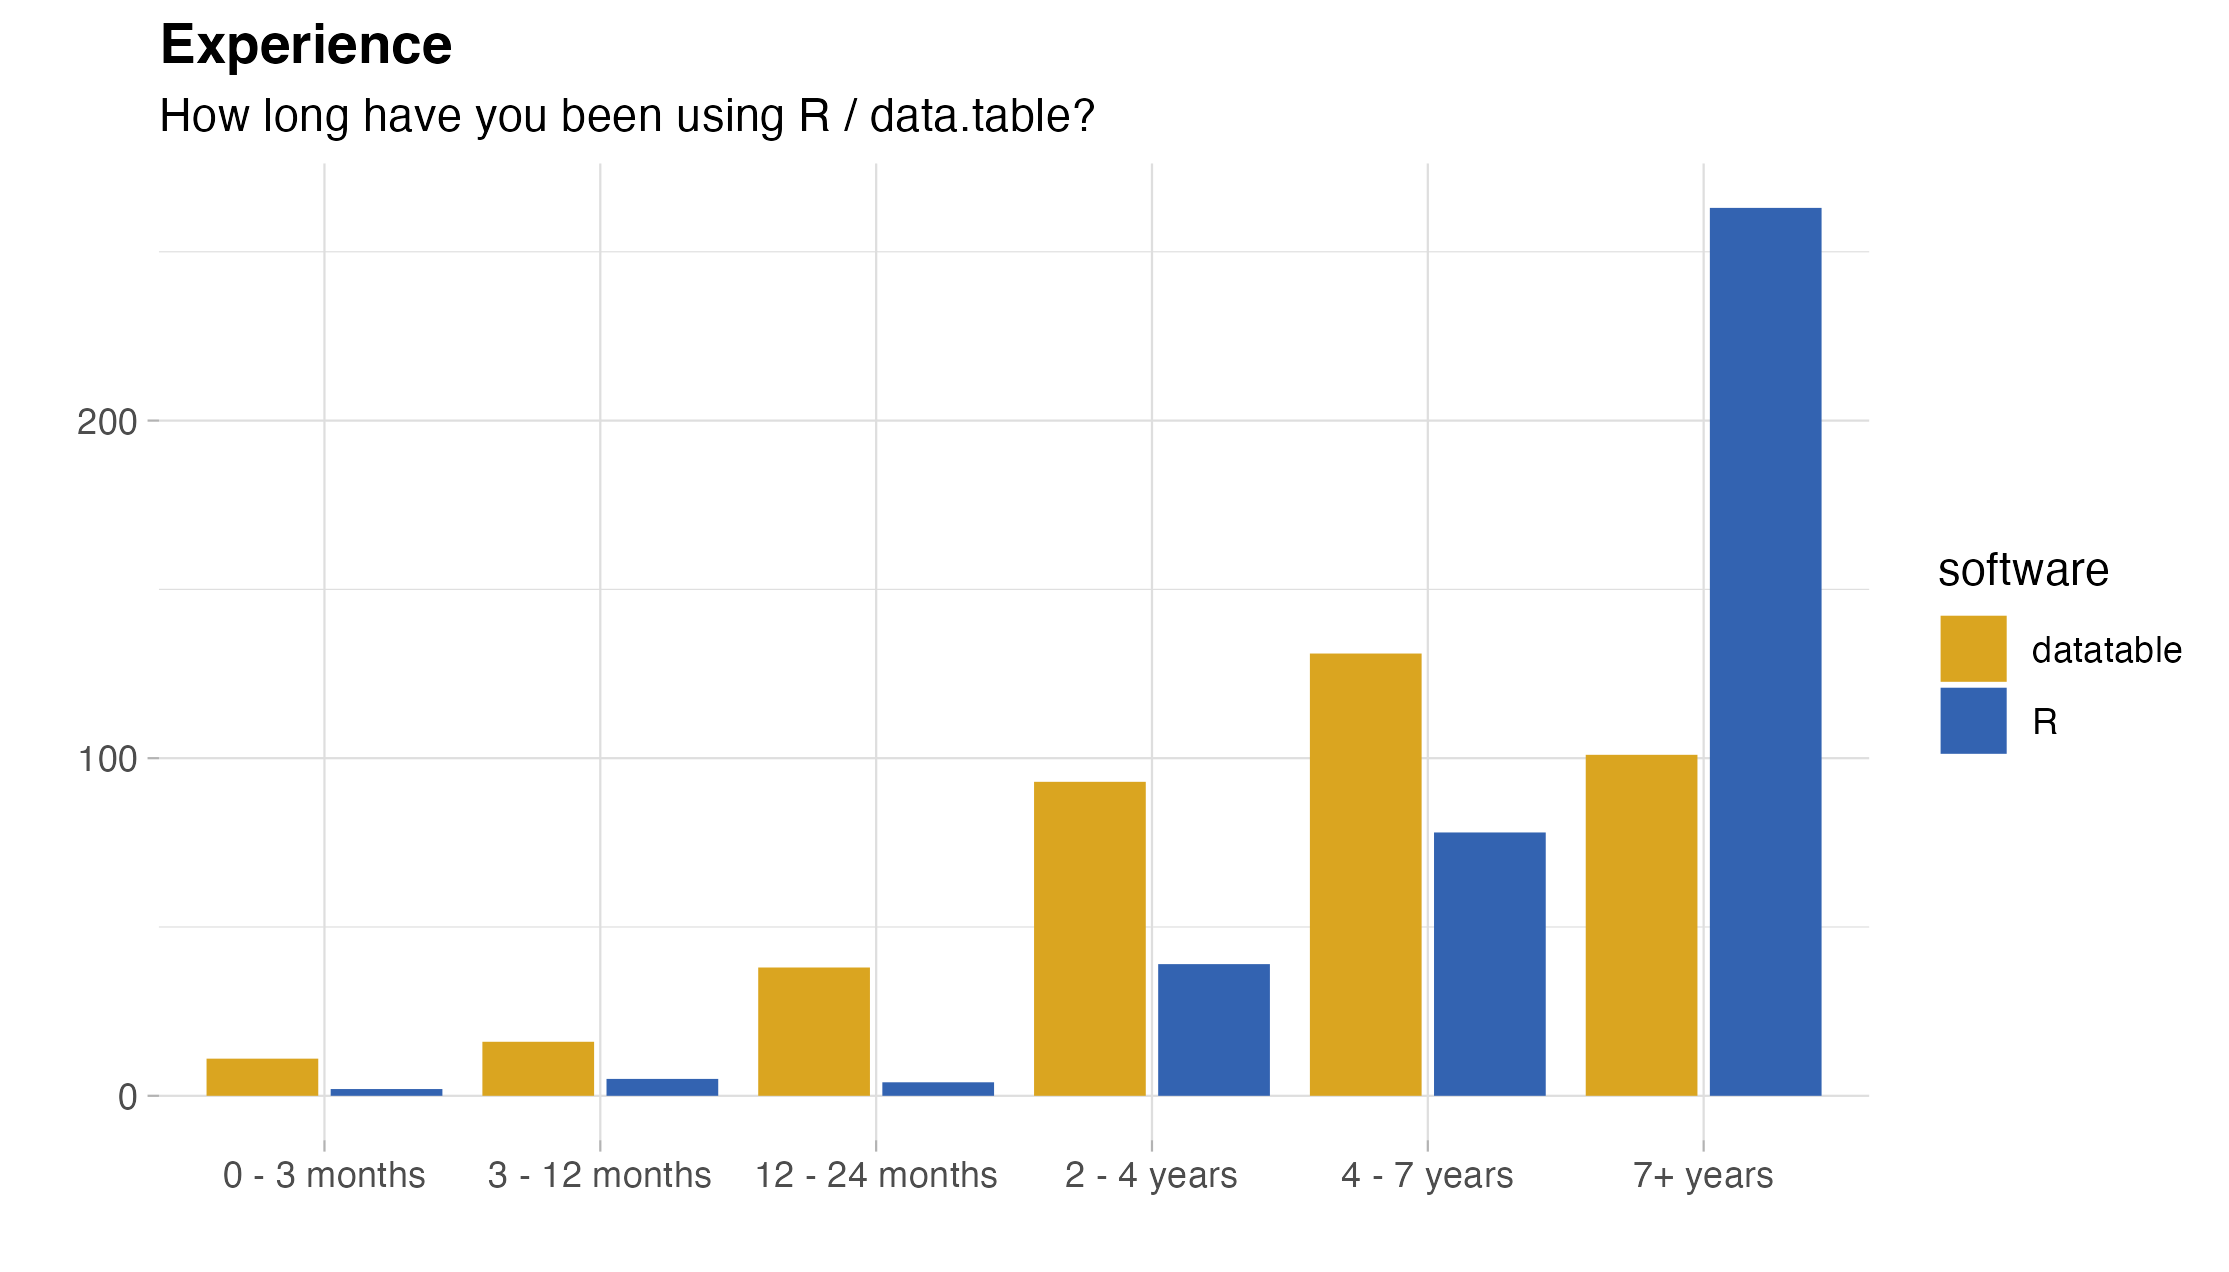
- an experienced user of R (87.2% having four or more years under their belt) and data.table (-||- 59.5%),
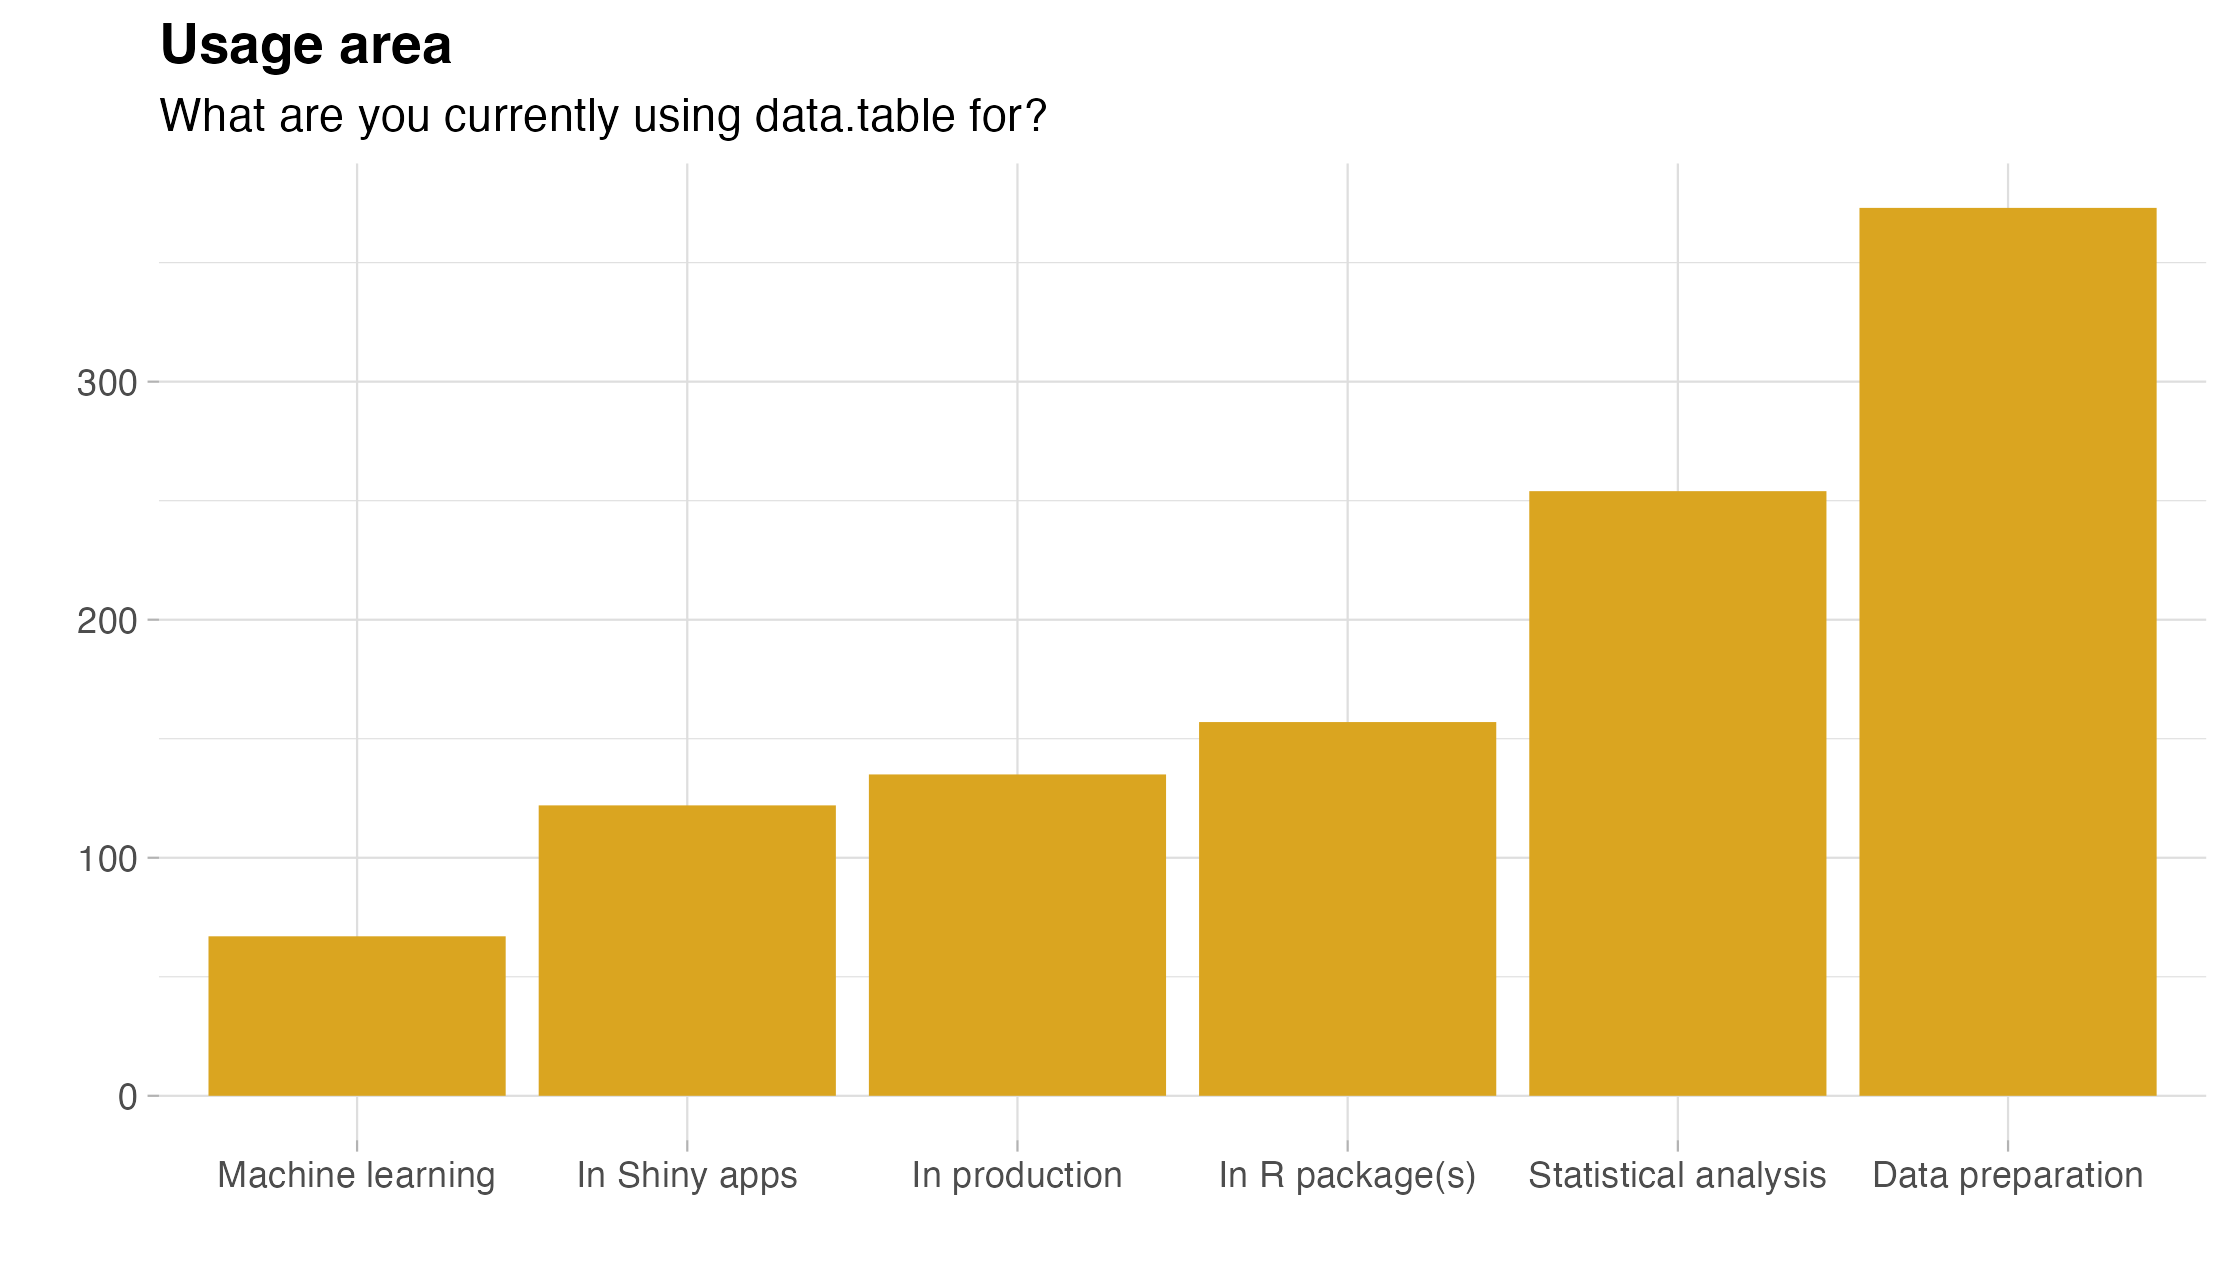
- using the package for data manipulation (95.9%) and statistical analysis (65.3%),
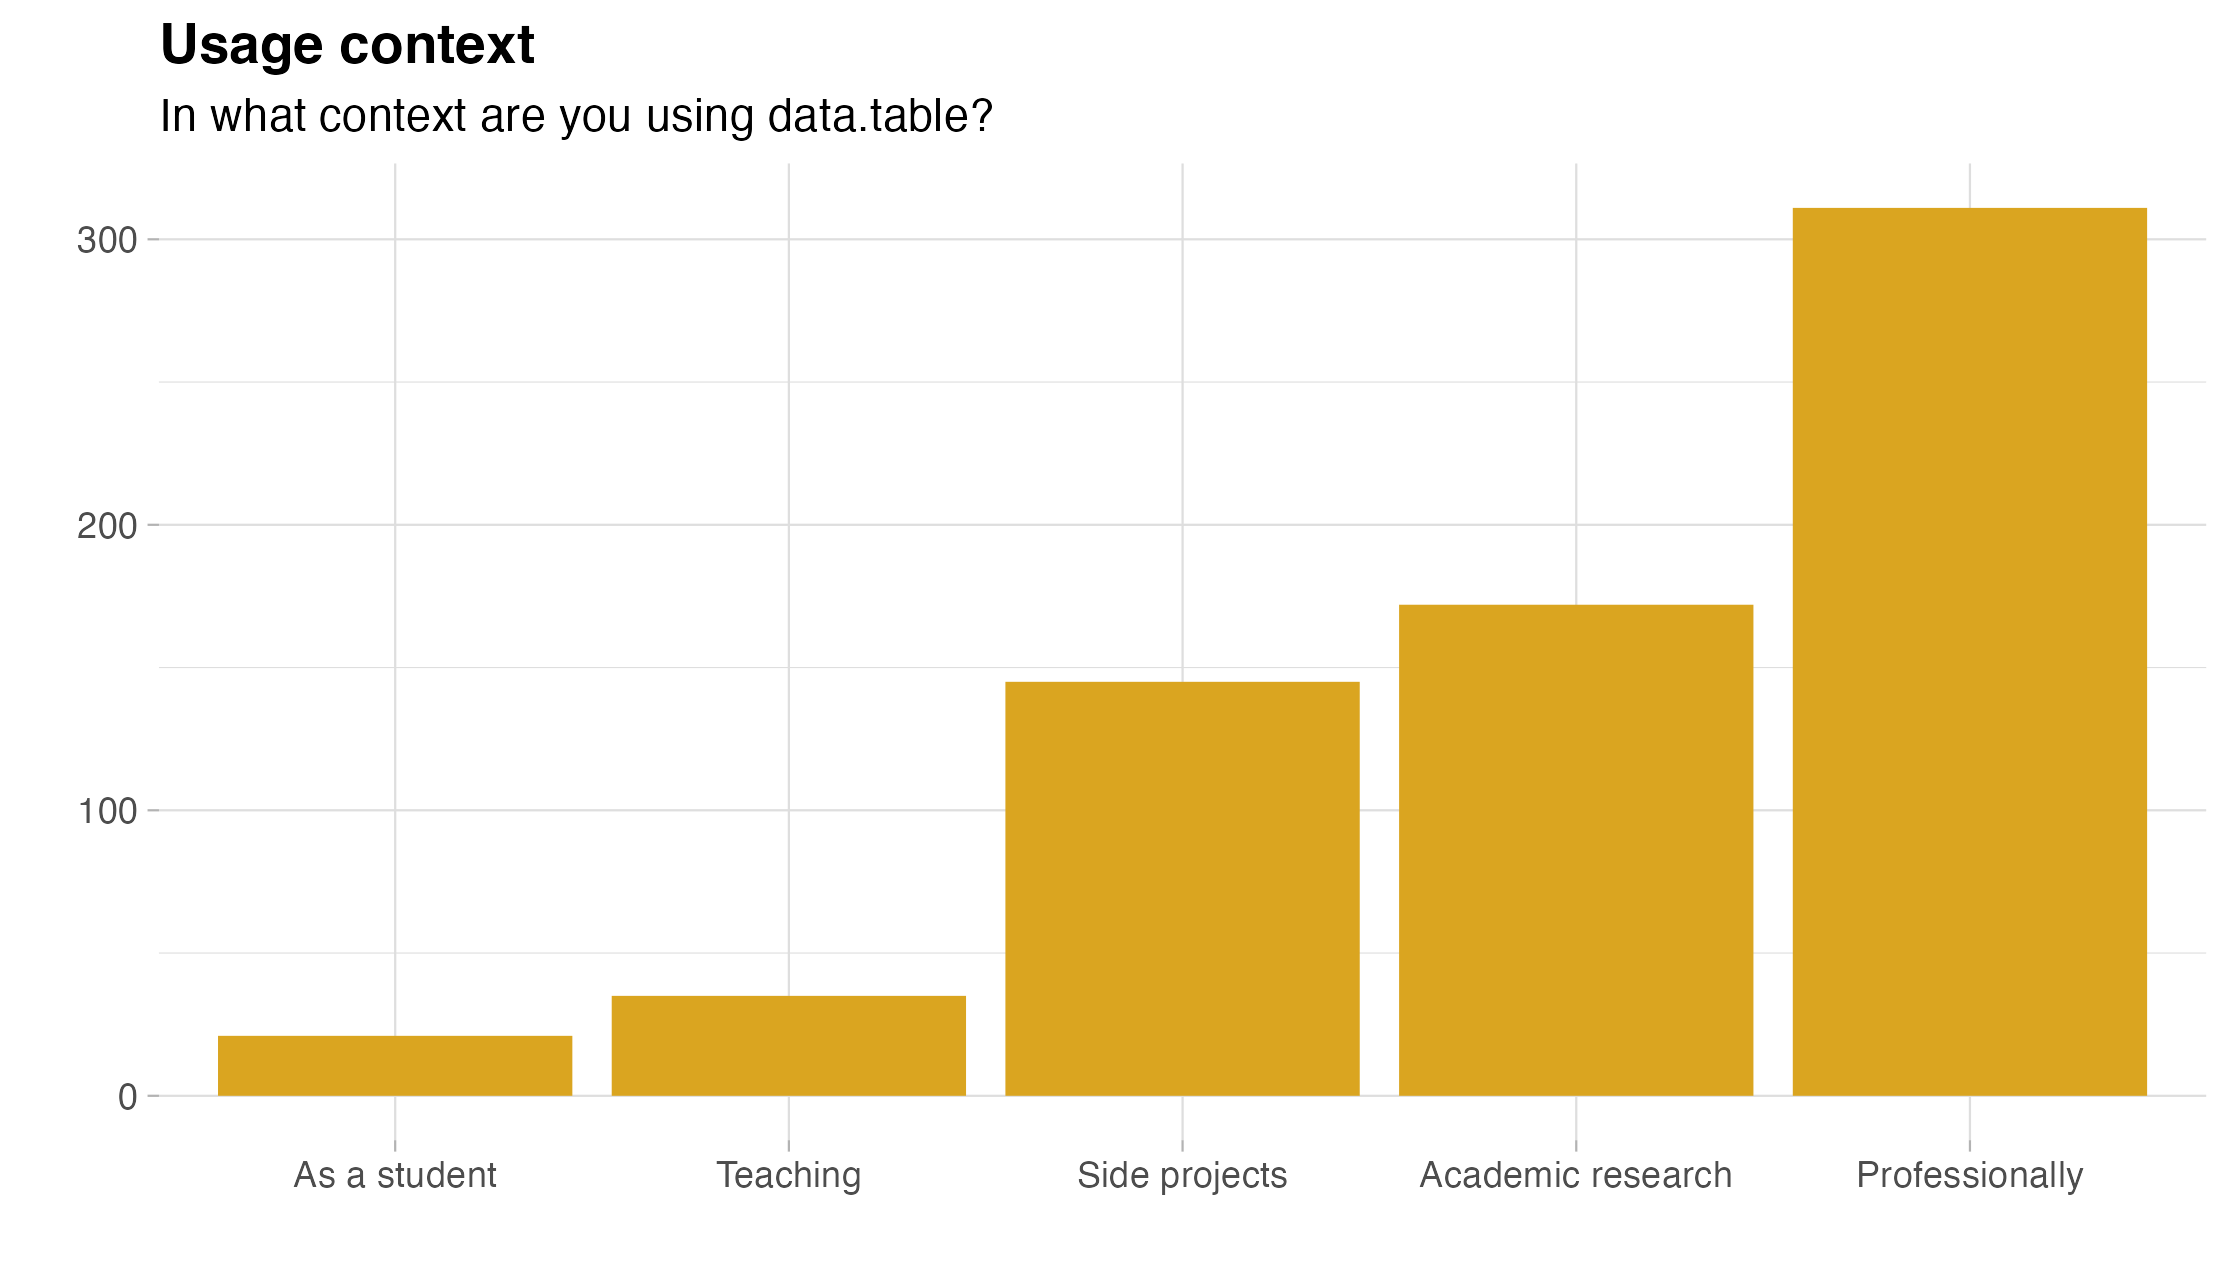
- in a professional context (80%),
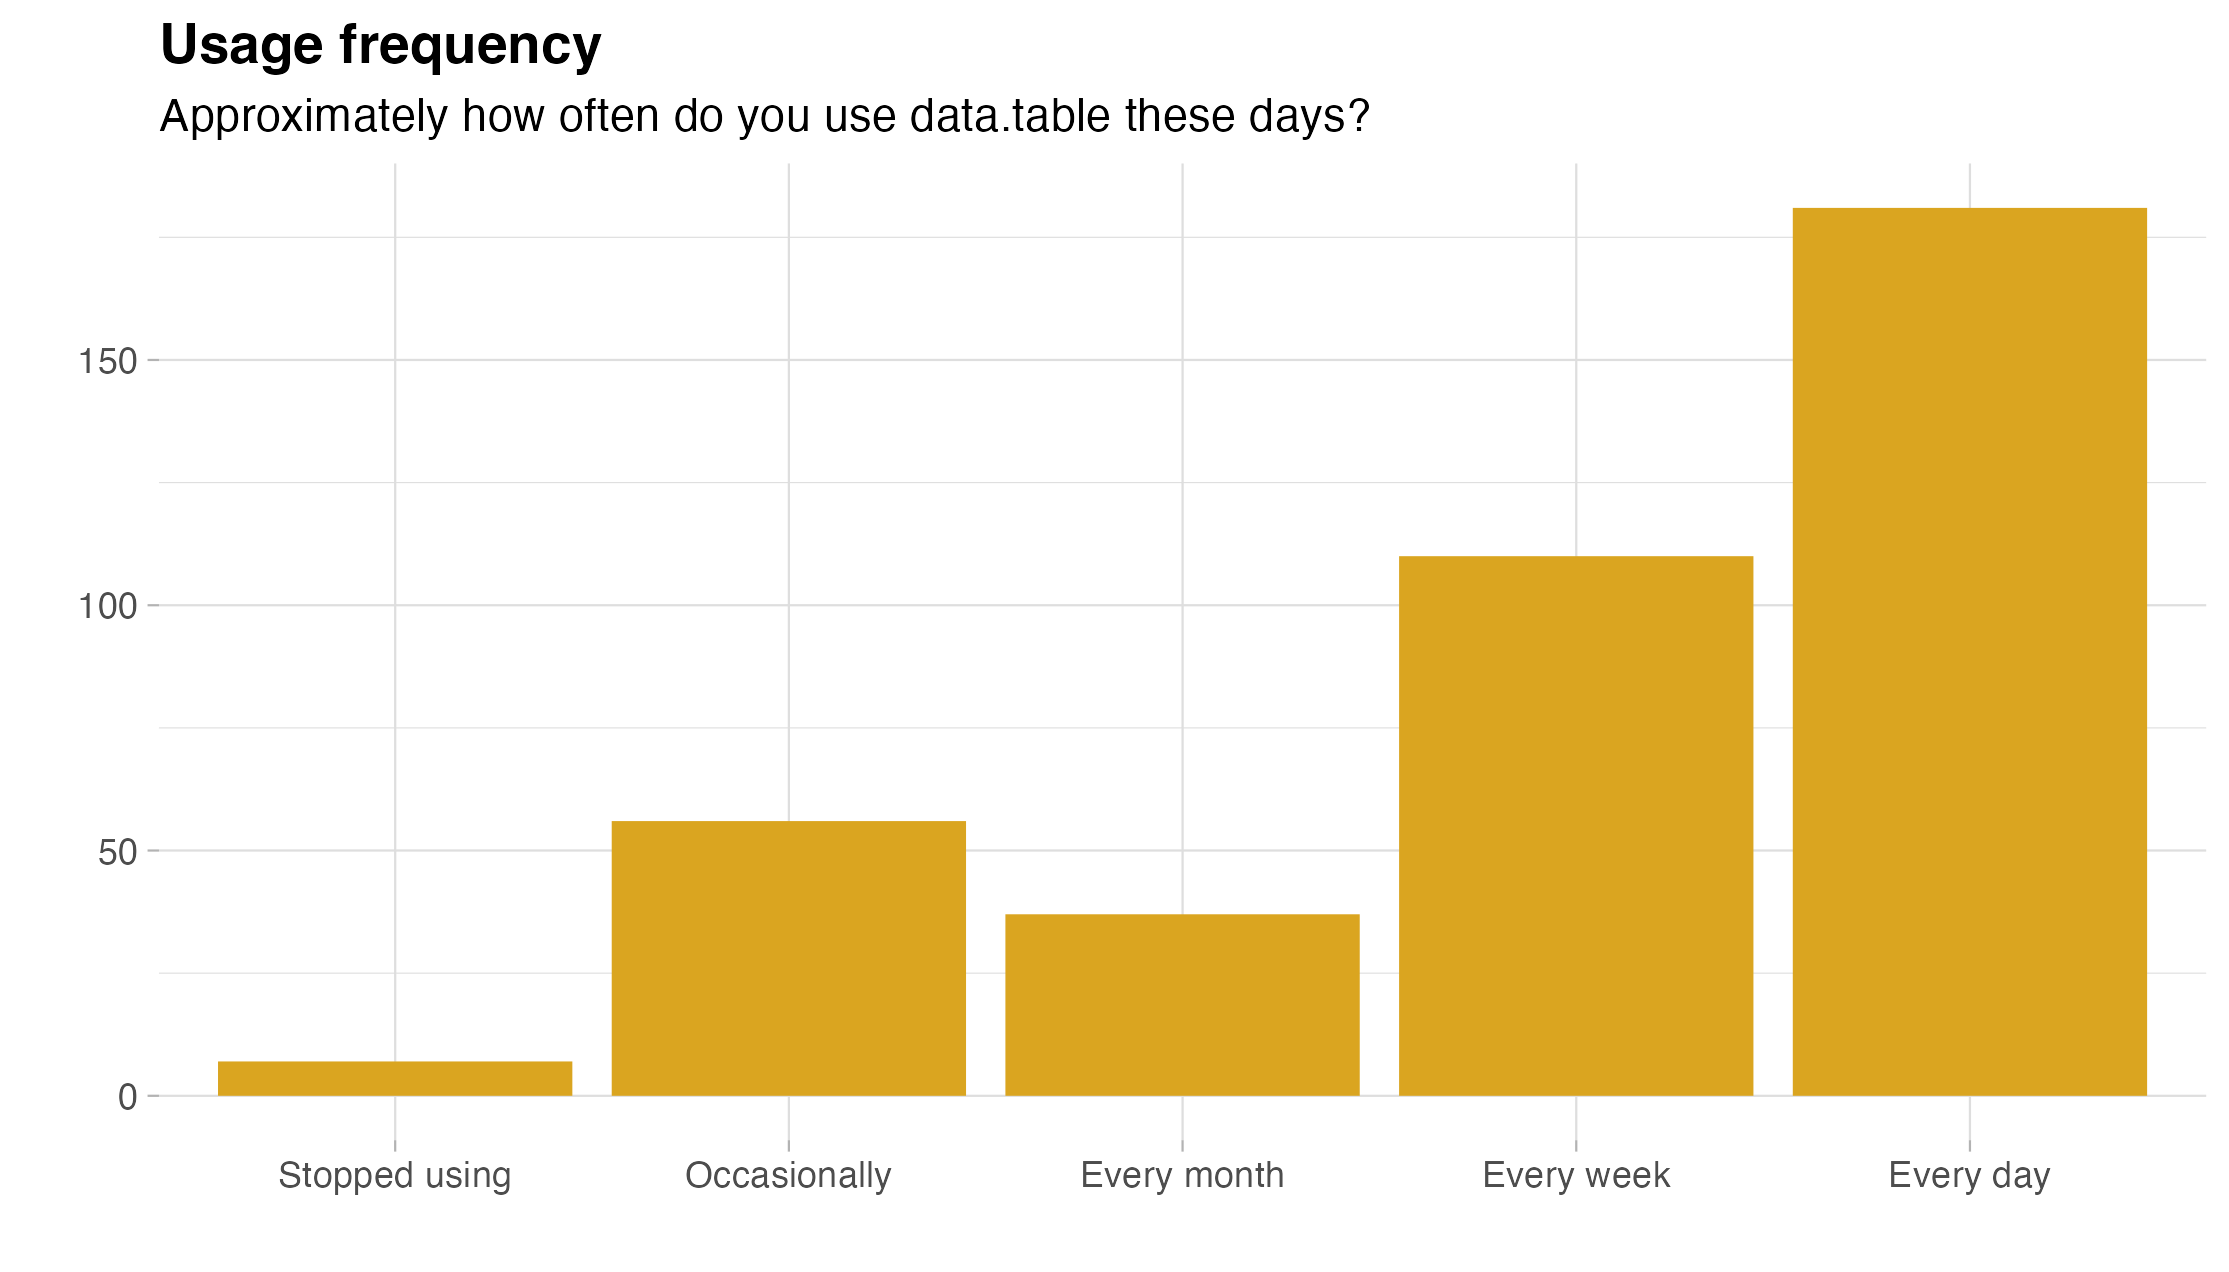
- on a daily (46.3%) or at least weekly (28.1%) basis.
For a richer summary, here are the corresponding bar charts:
The good and the bad
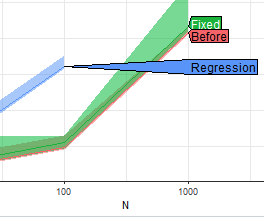
What do users appreciate most about data.table? A scan of the answers to this open-ended question quickly reveals a clear winner: performance. Nearly every answer brings up speed or memory efficiency.
“Speed! When I need speed, I turn directly to data.table.”
The runner-up is syntax, with users praising its concision and expressiveness. At the same time, however, syntax often appears in the answers to the question about the biggest challenges in using data.table. For some users it is too concise or difficult to remember. Some users highlighted specific functionality that they find difficult to use: reshaping (dcast/melt) is brought up most often, followed by joining.
“Some queries are so surprisingly simple for complex operations”
“Still can’t get used to the syntax, have to look it up every time”
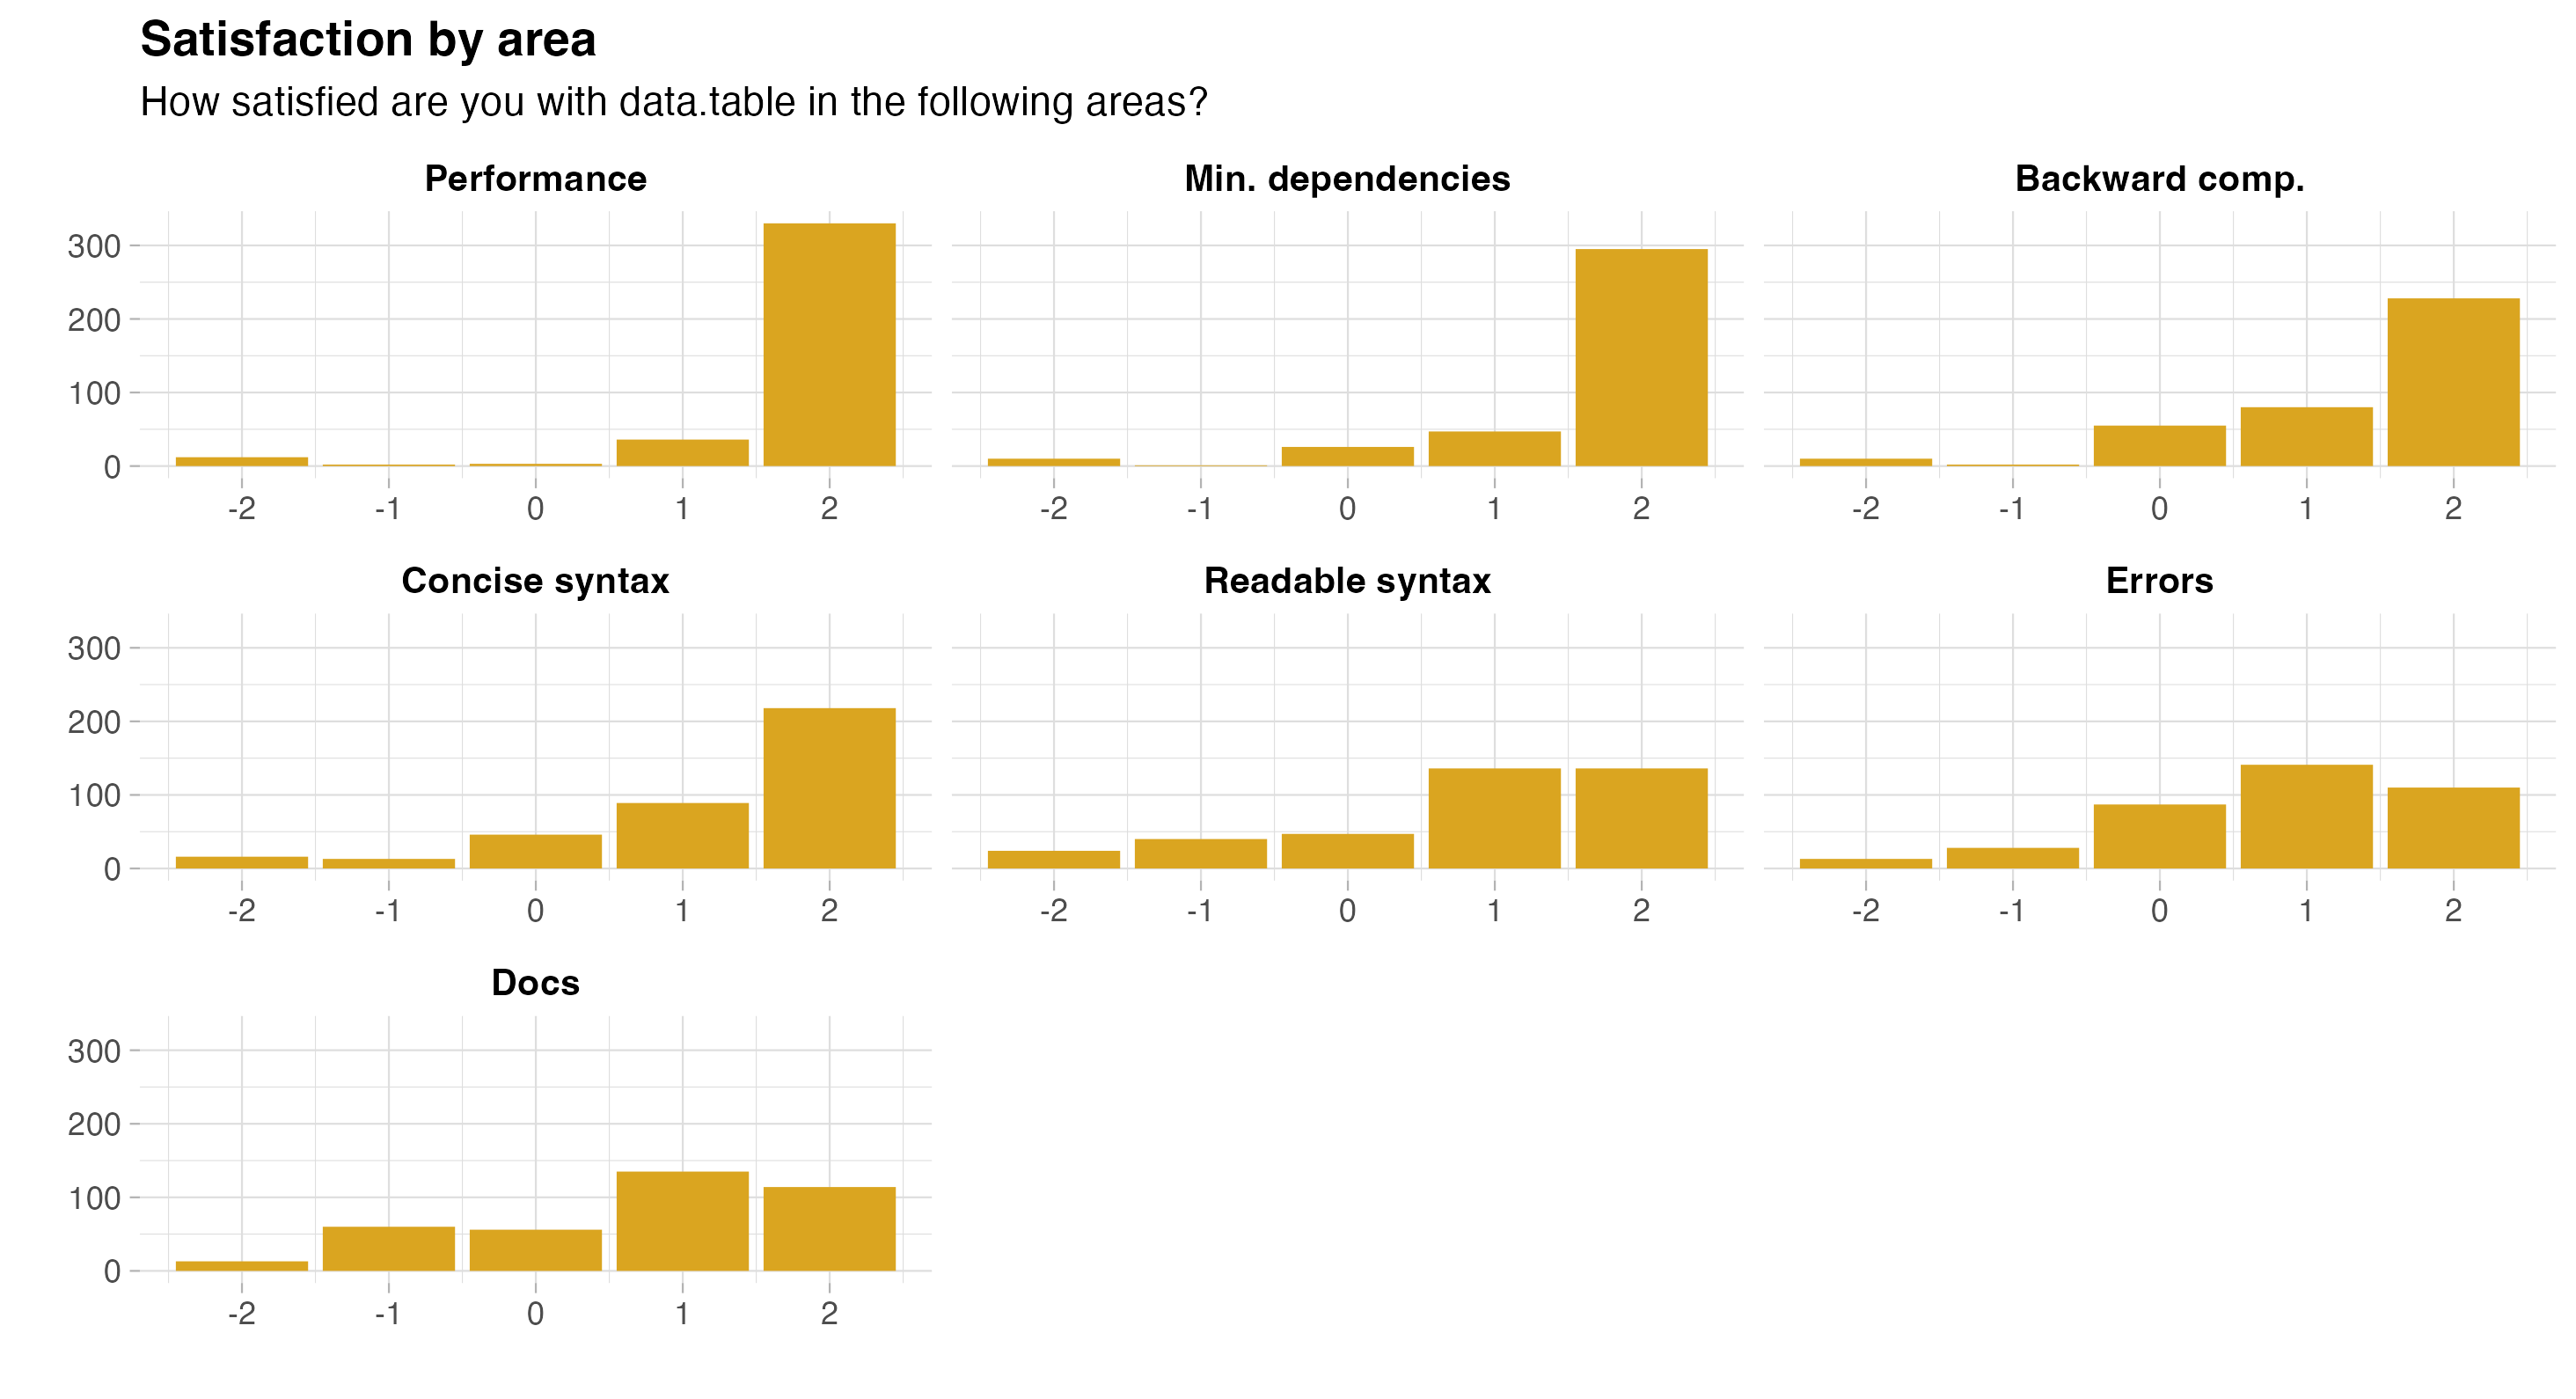
We explored this topic in a more structured way as well, by asking about the following areas:
- Performance (speed & ability to handle large datasets)
- Code readability
- Concise syntax
- Few changes that break old code
- Minimal dependencies
- Error messages
- Documentation
The possible answers were Very dissatisfied, Somewhat dissatisfied, Neither satisfied nor dissatisfied, Somewhat satisfied, Very satisfied, which I mapped to -2:2 below. The majority of users are Very satisfied with performance (86.2%), minimal dependencies (77.8%), backward compatibility (60.8%), and syntax concision (57.1%). Syntax readability (35.5%), error messages (29.0%), and documentation (30.2%) lag behind.
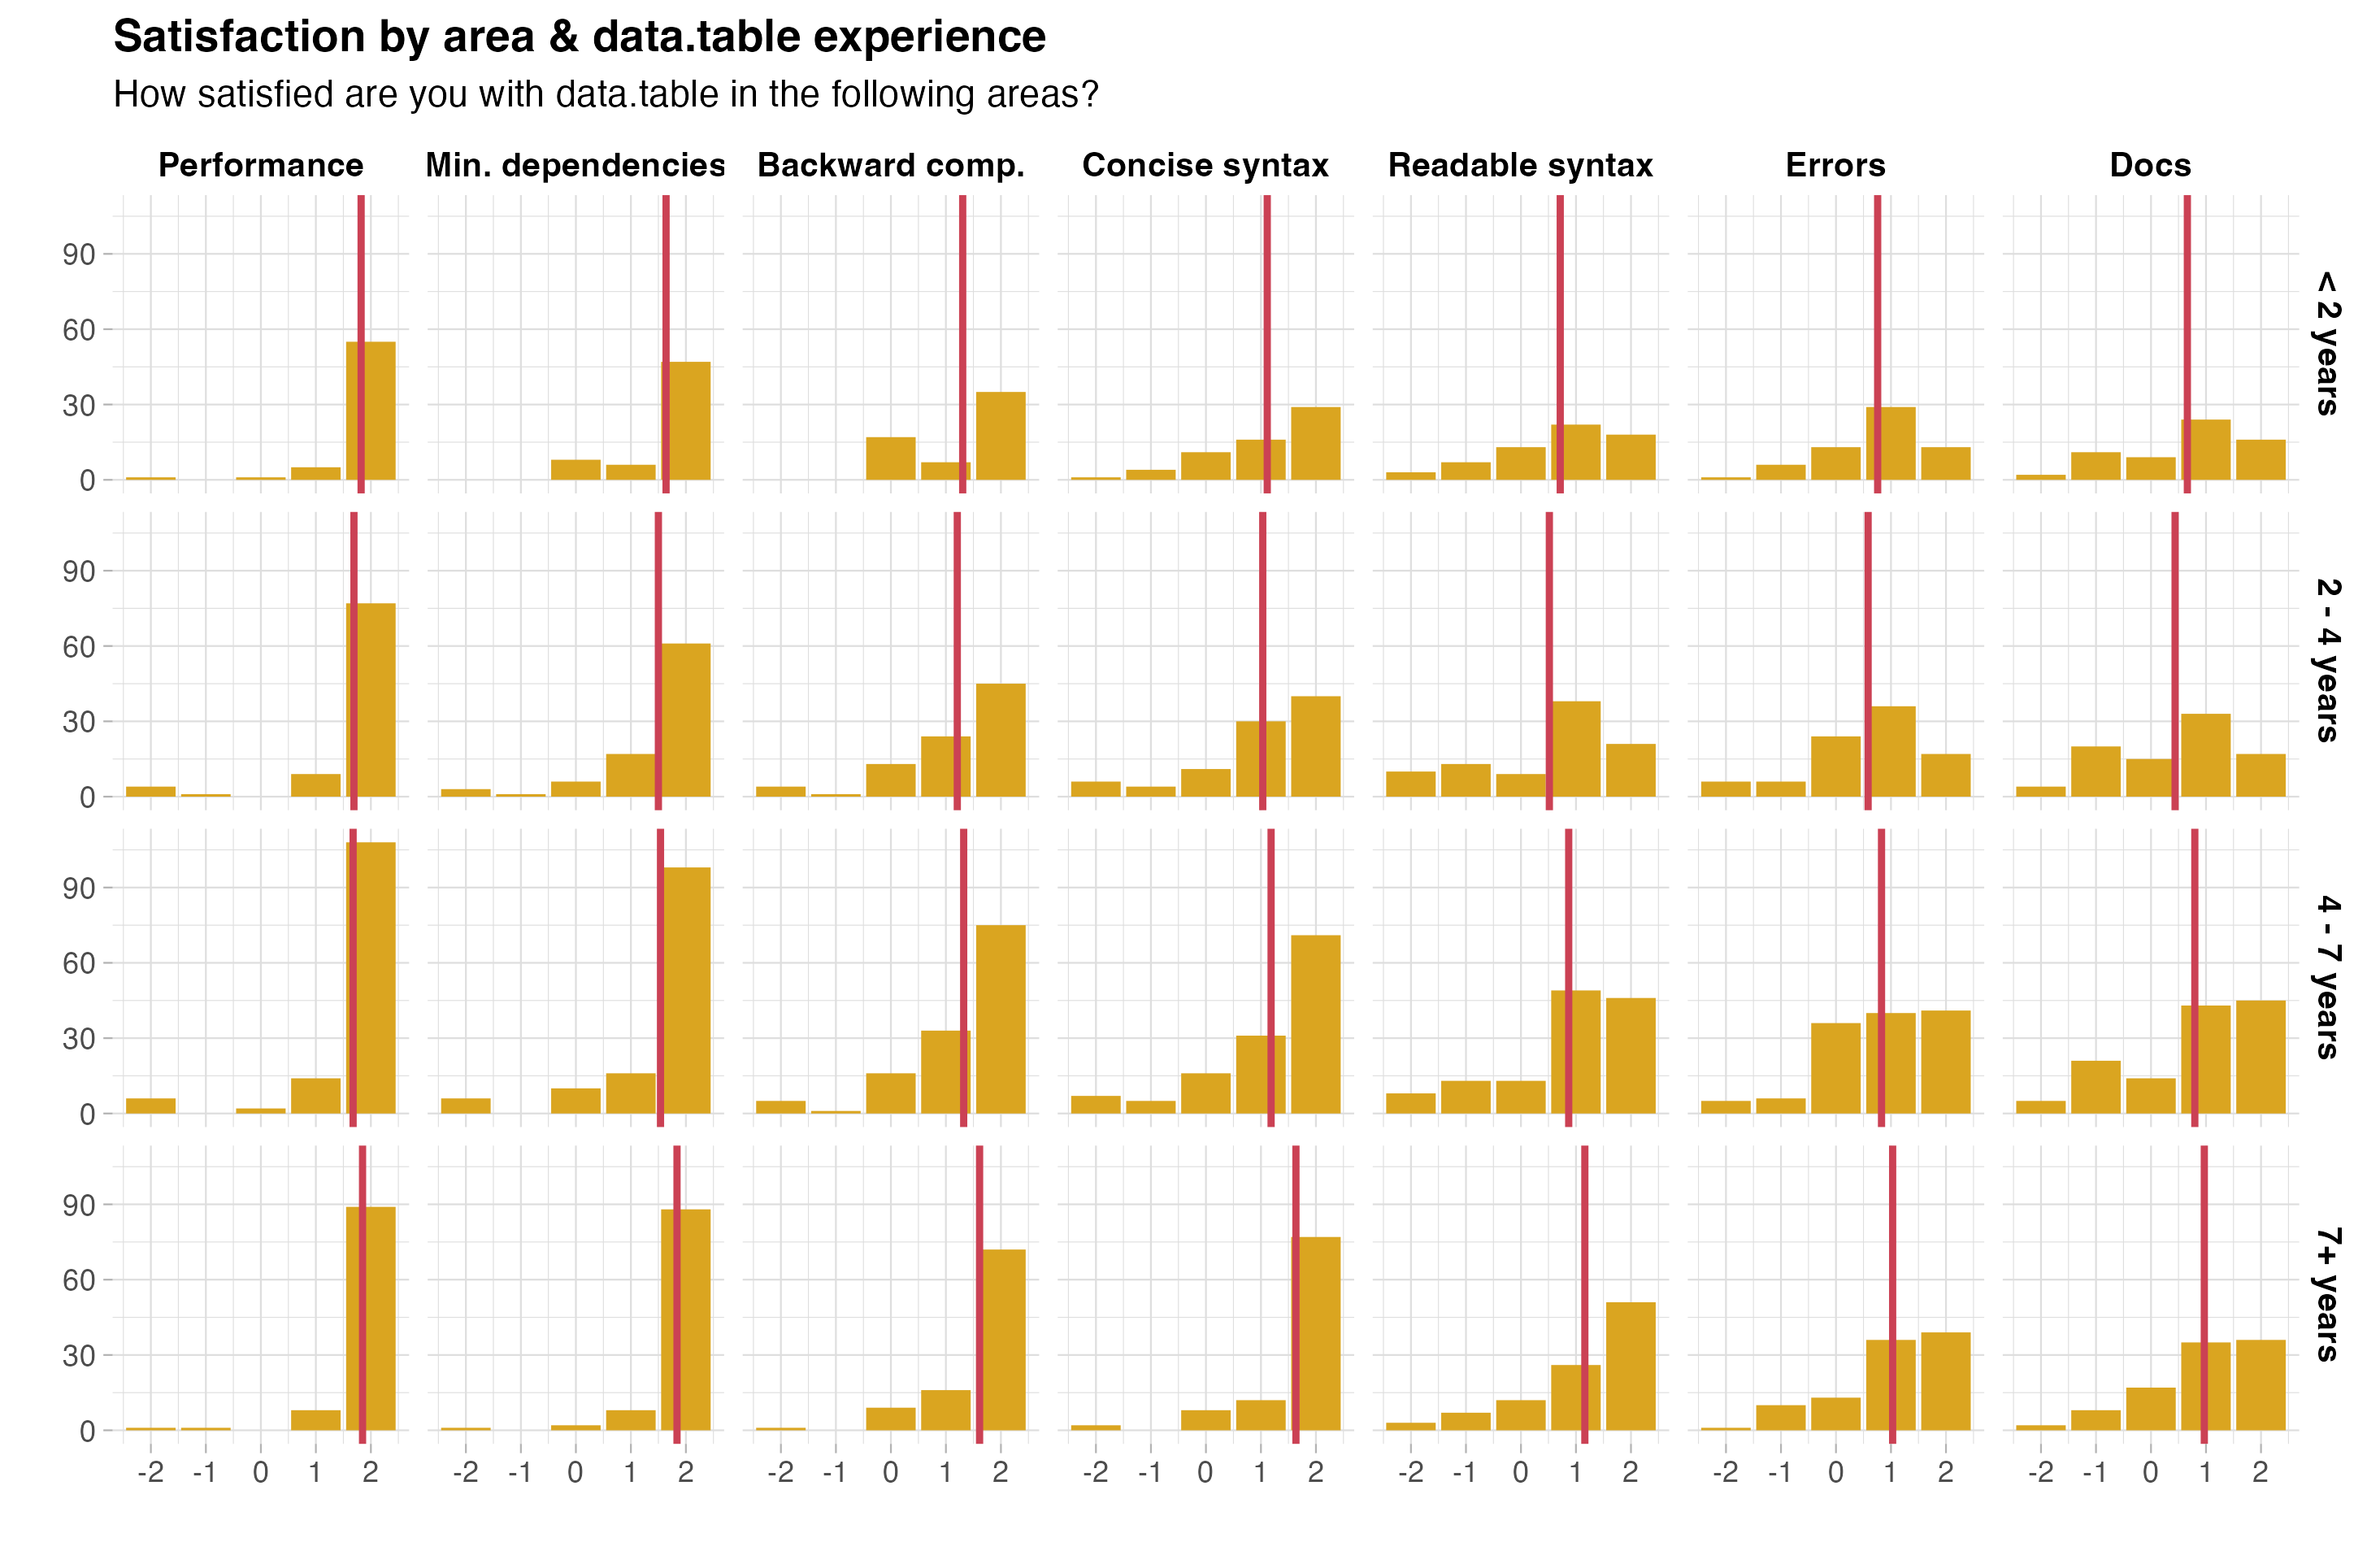
 Does this pattern hold across all levels of data.table experience? The following plot shows the average (vertical red line) in addition to the distribution of answers across the different levels of experience.
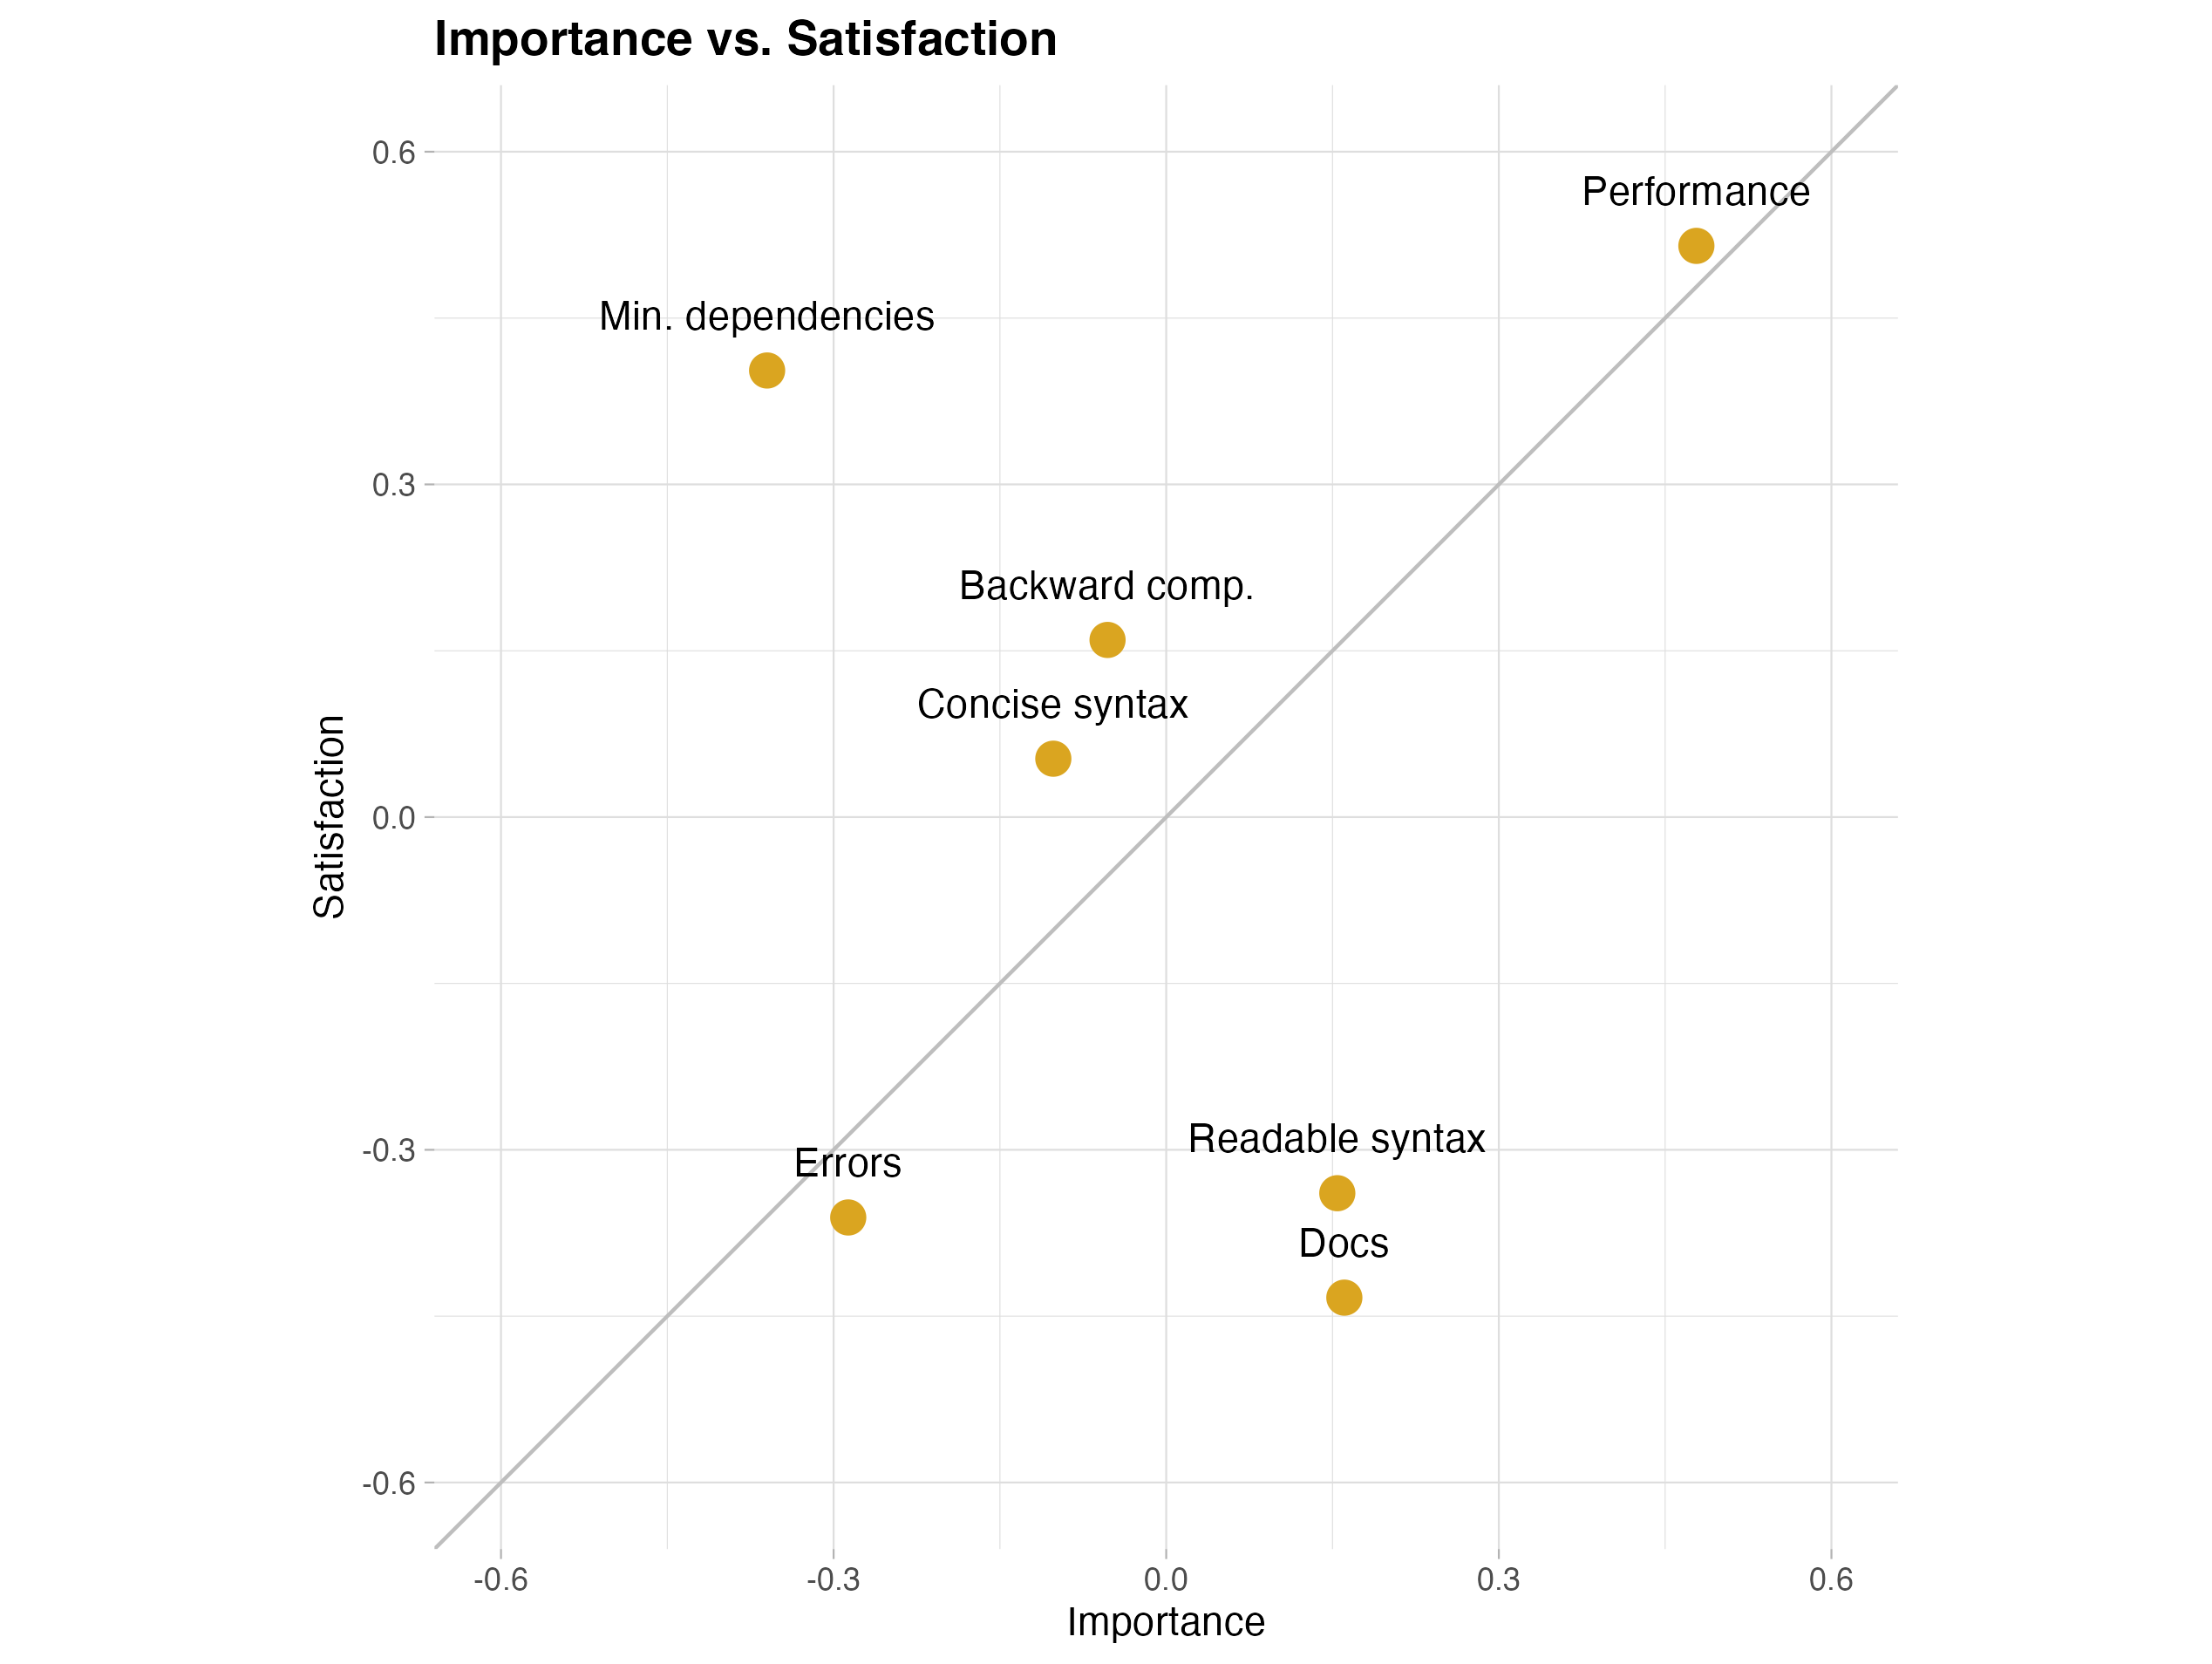
A way to contextualize these results is to consider how important the different areas are. Another grid question featured this same set of areas, but asked about their importance to the user. I standardized the satisfaction & importance scores and plot the averages below. The two areas that score relatively high in importance but relatively low in satisfaction are syntax readability and quality of documentation.
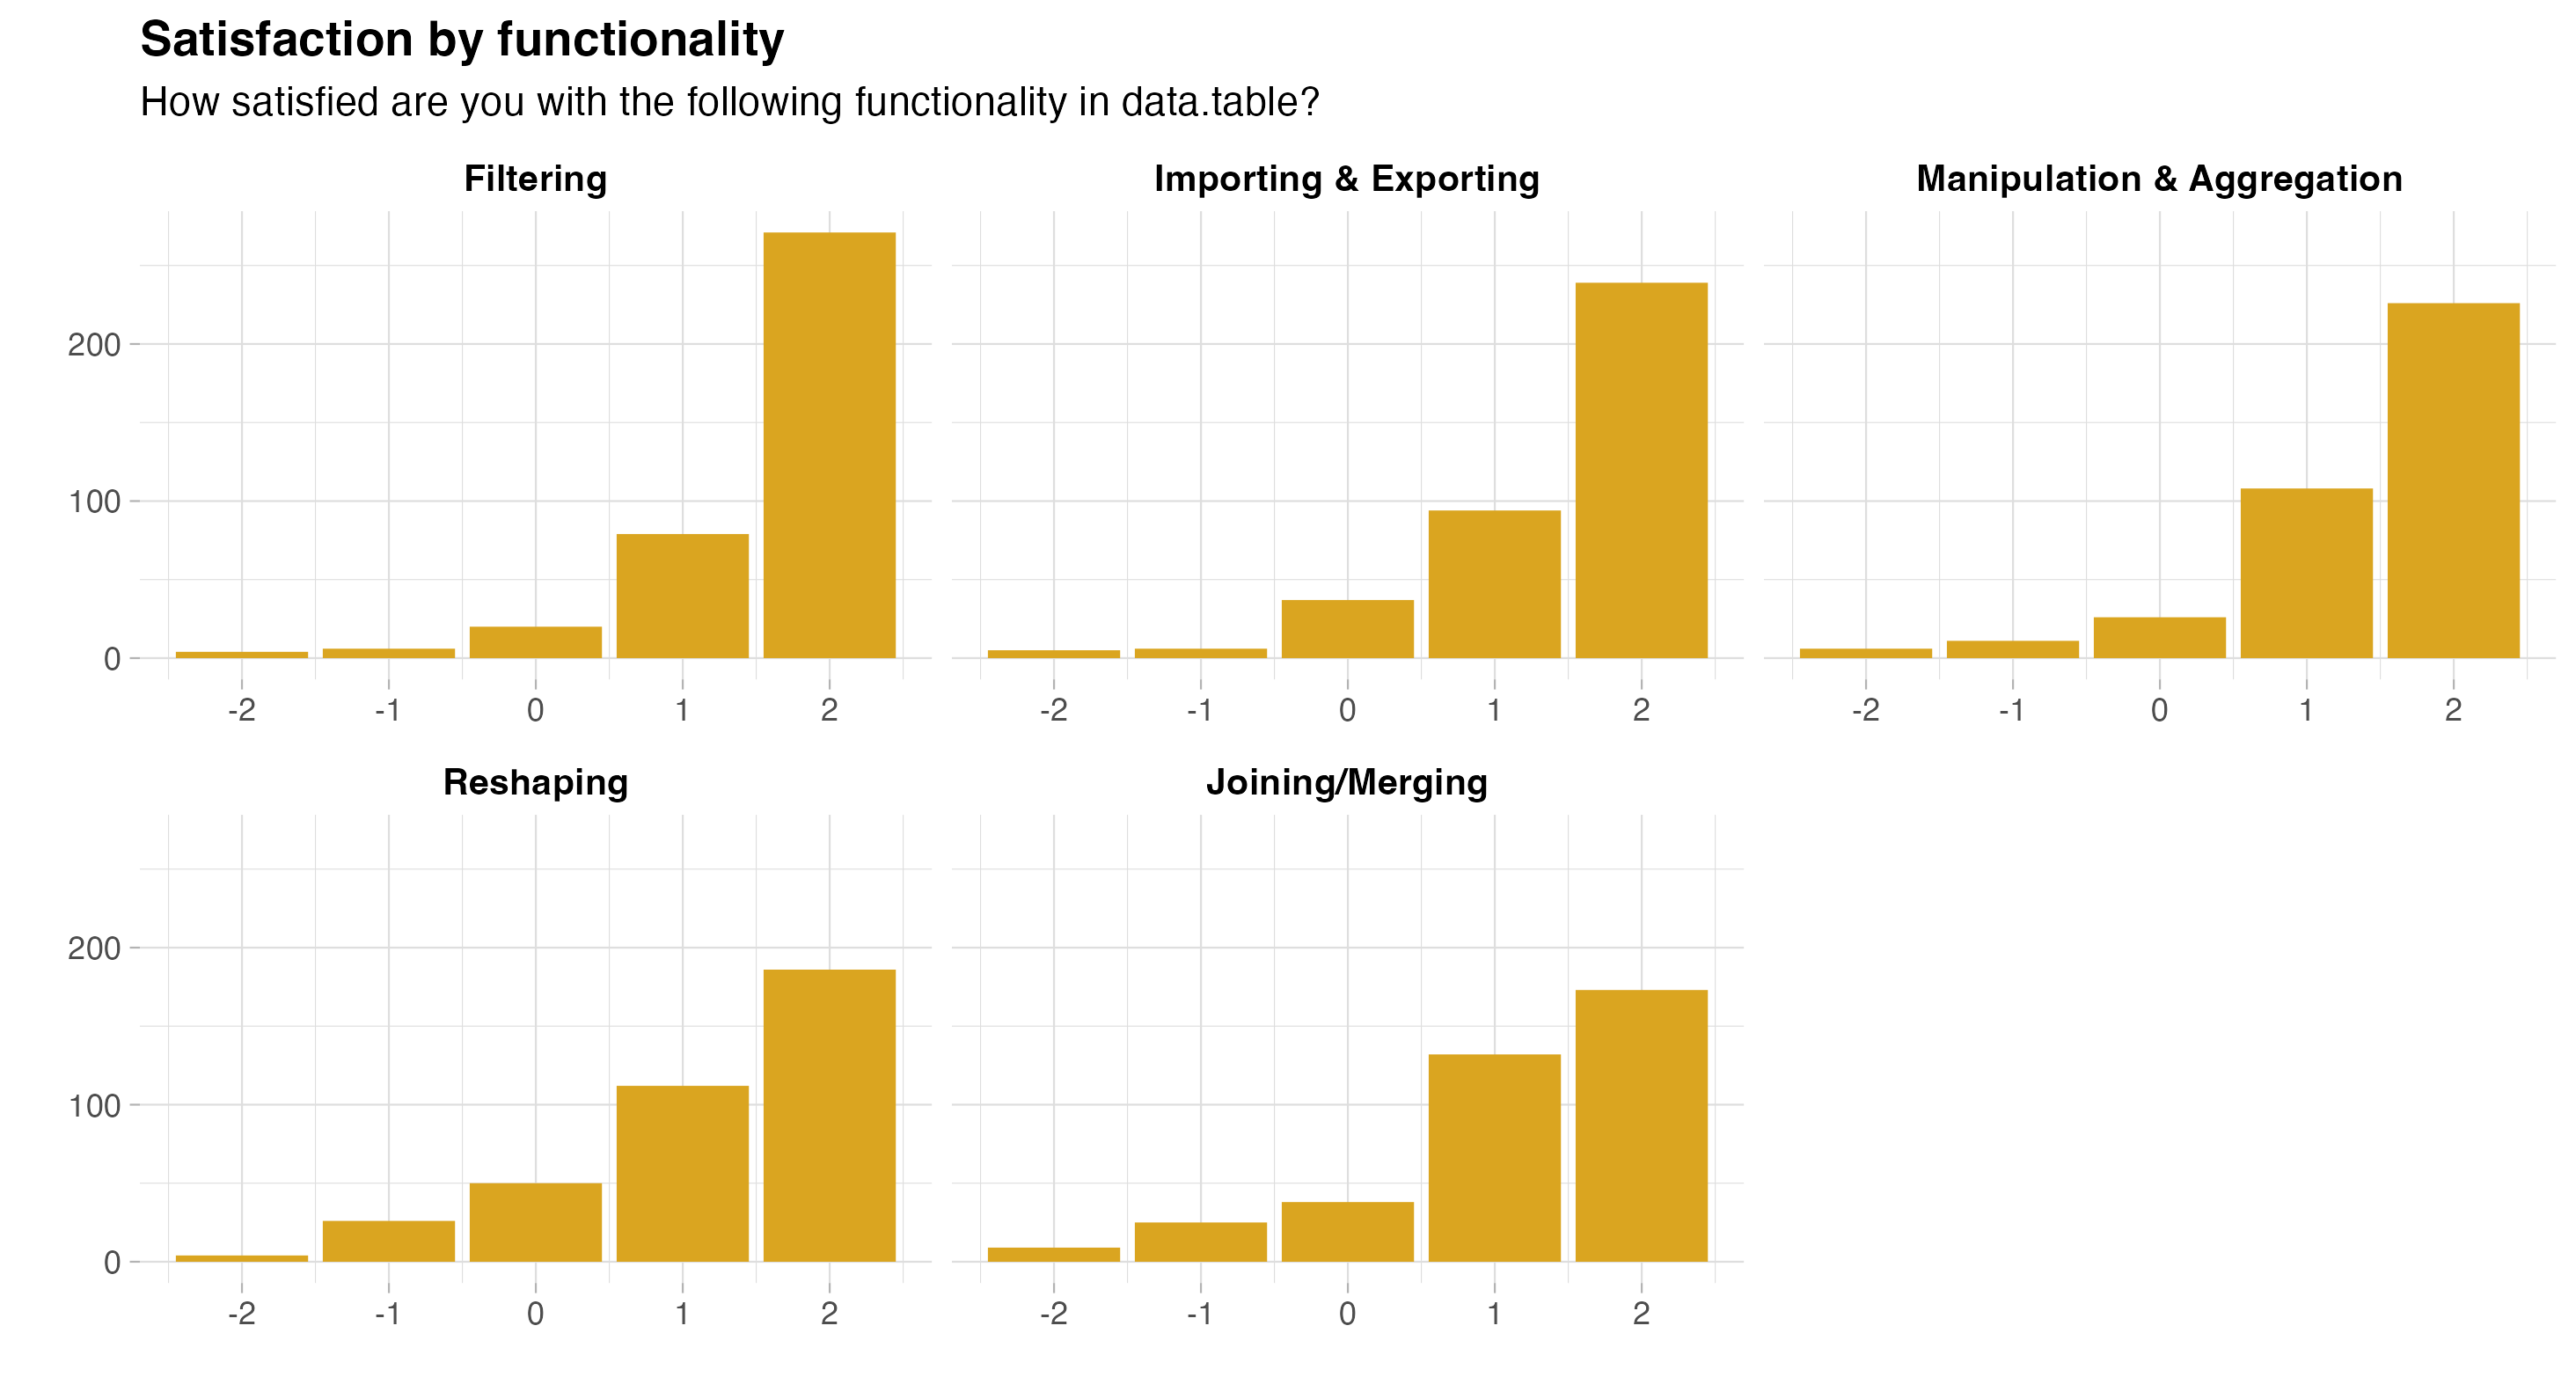
Another grid question asked about users’ satisfaction with:
- importing & exporting
- filtering
- manipulation & aggregation
- reshaping
- joining/merging
While Very satisfied was the dominant response for every area, the results are consistent with earlier qualitative observations in that the share of users selecting this response is substantially lower for reshaping (49.2%) and joining (45.9%) than the other areas (manipulation & aggregation 59.9%, import/export 62.7%, filtering 71.3%).
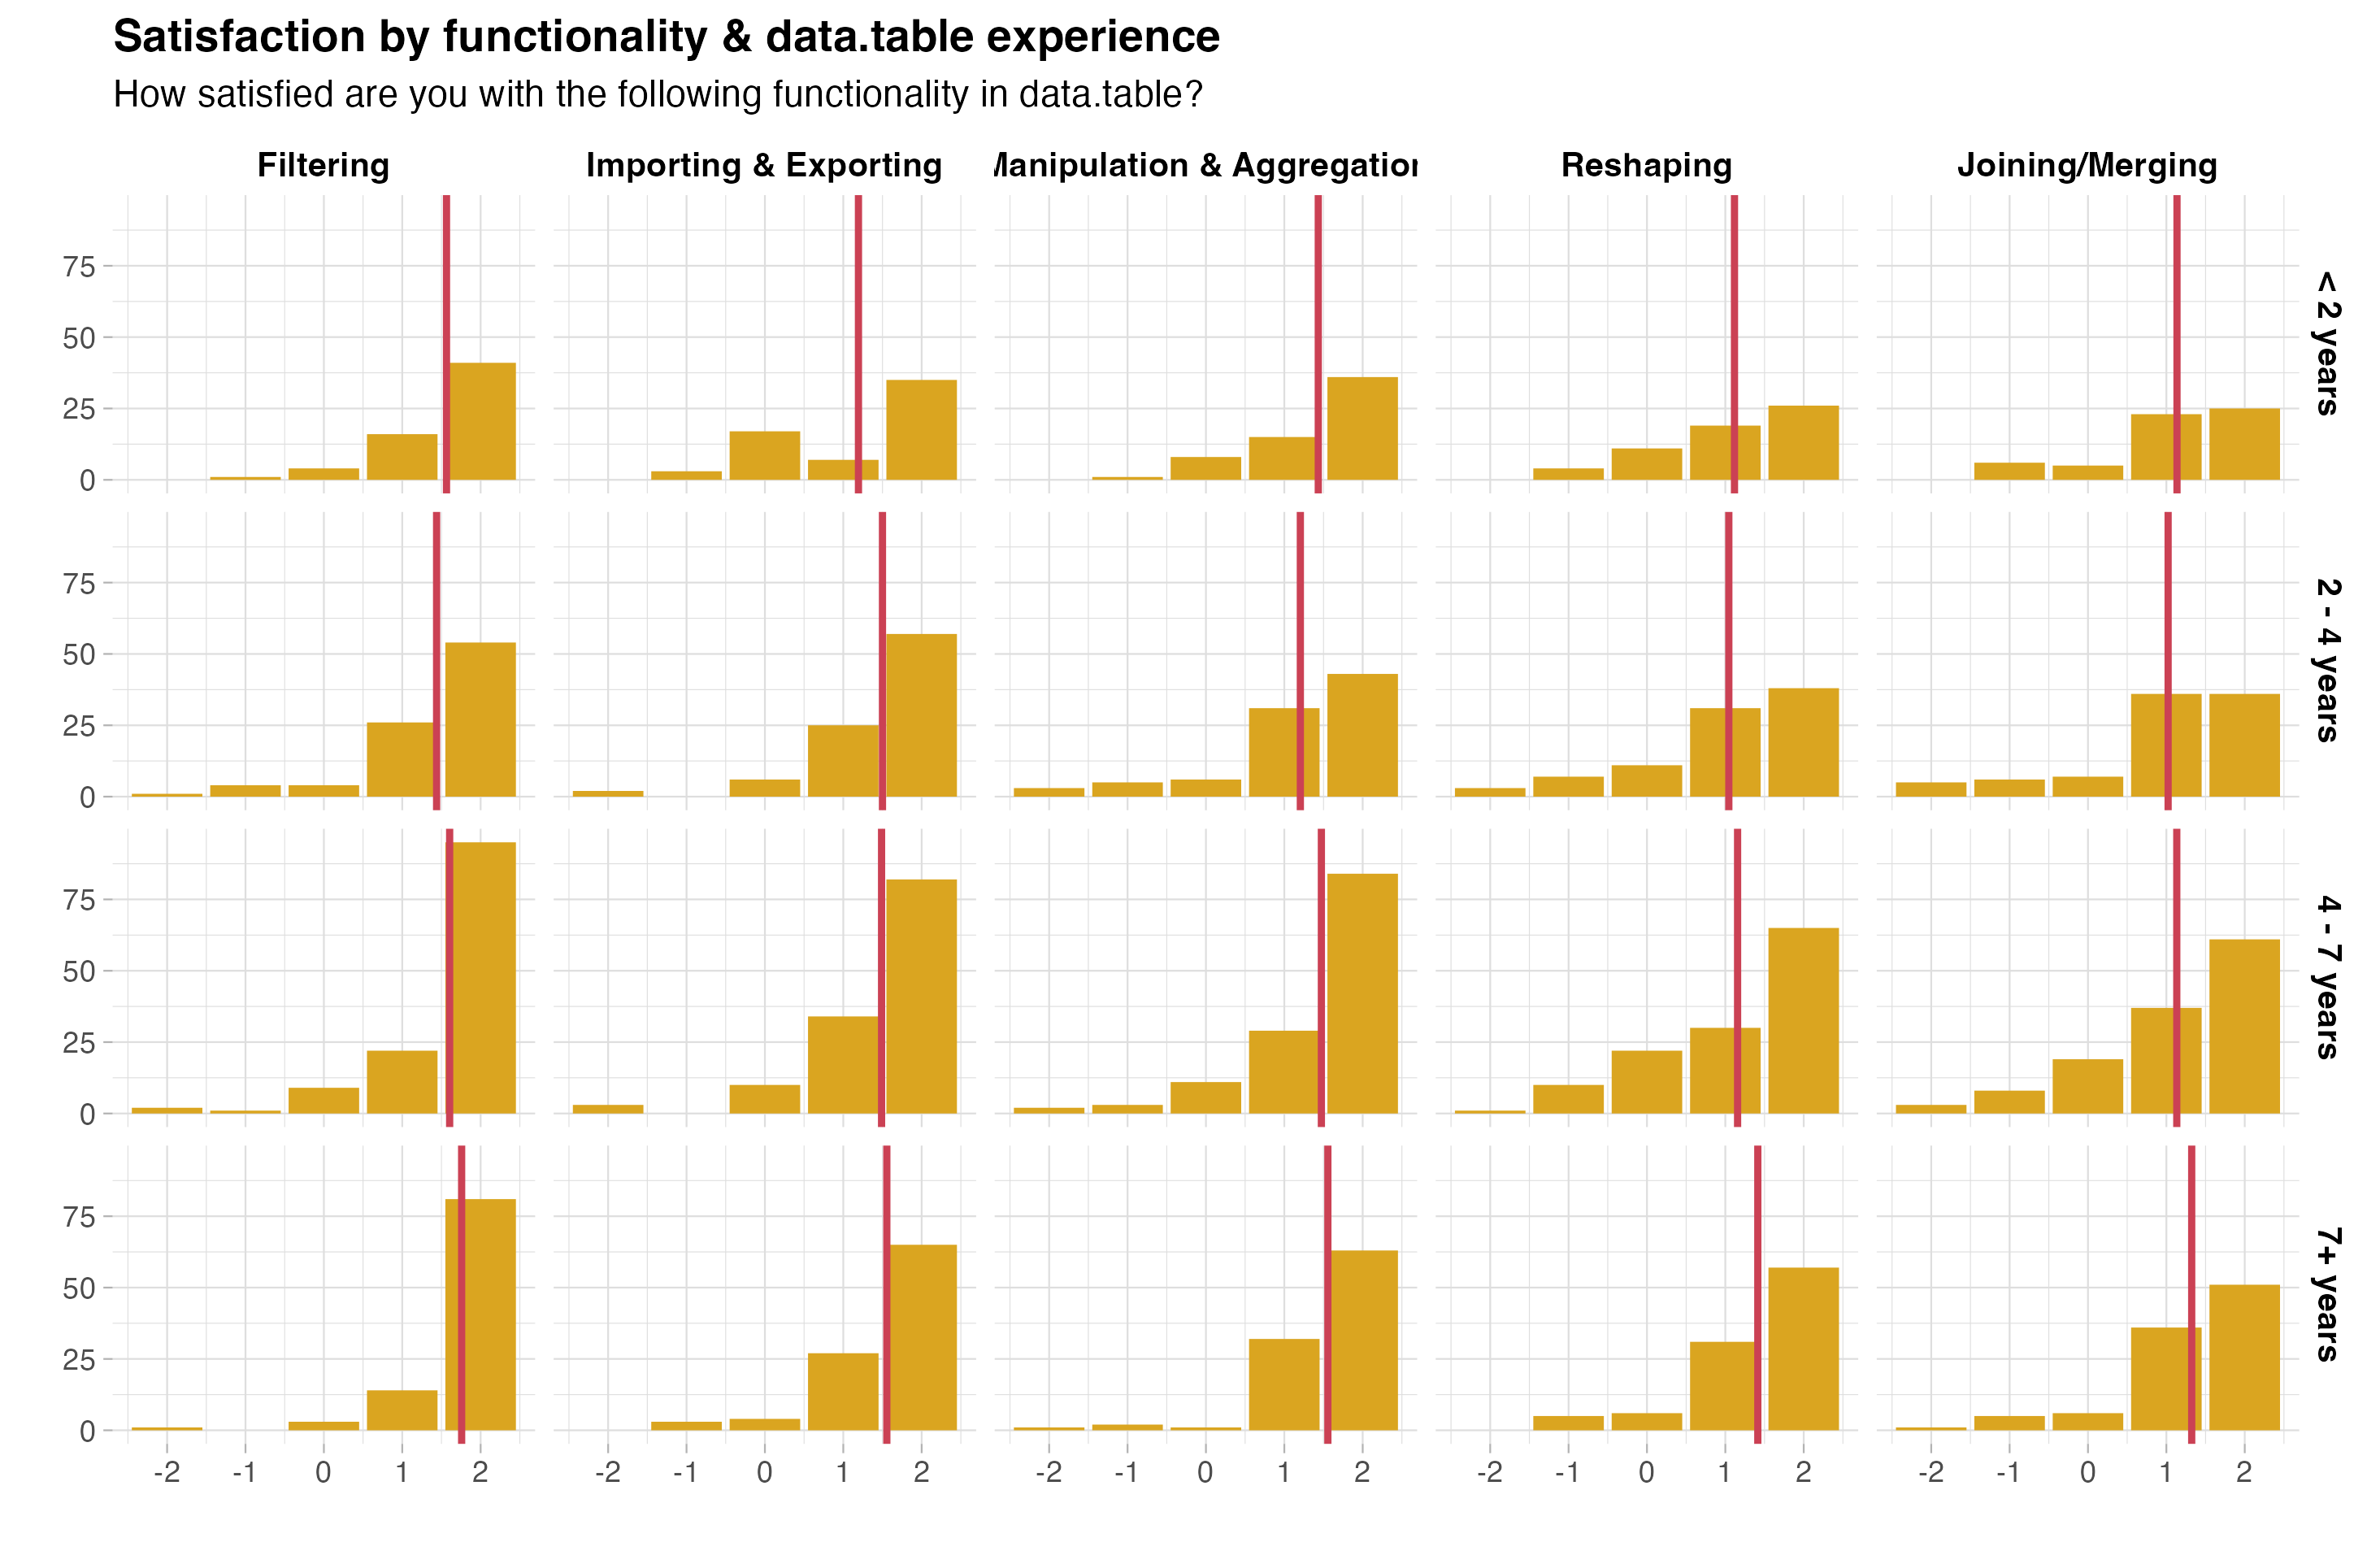
 The next plot considers variation across levels of data.table experience. One area where beginners (less than 2 years of experience) are less satisfied compared to other users is importing & exporting.
Desired functionality
What extra functionality would users like to see? The answers to this question covered a lot of different ground, but the three clear winners (with at least 10 mentions each) were:
- support for out-of-memory processing,
- richer import/export functionality (parquet was mentioned most often, followed by xlsx), and
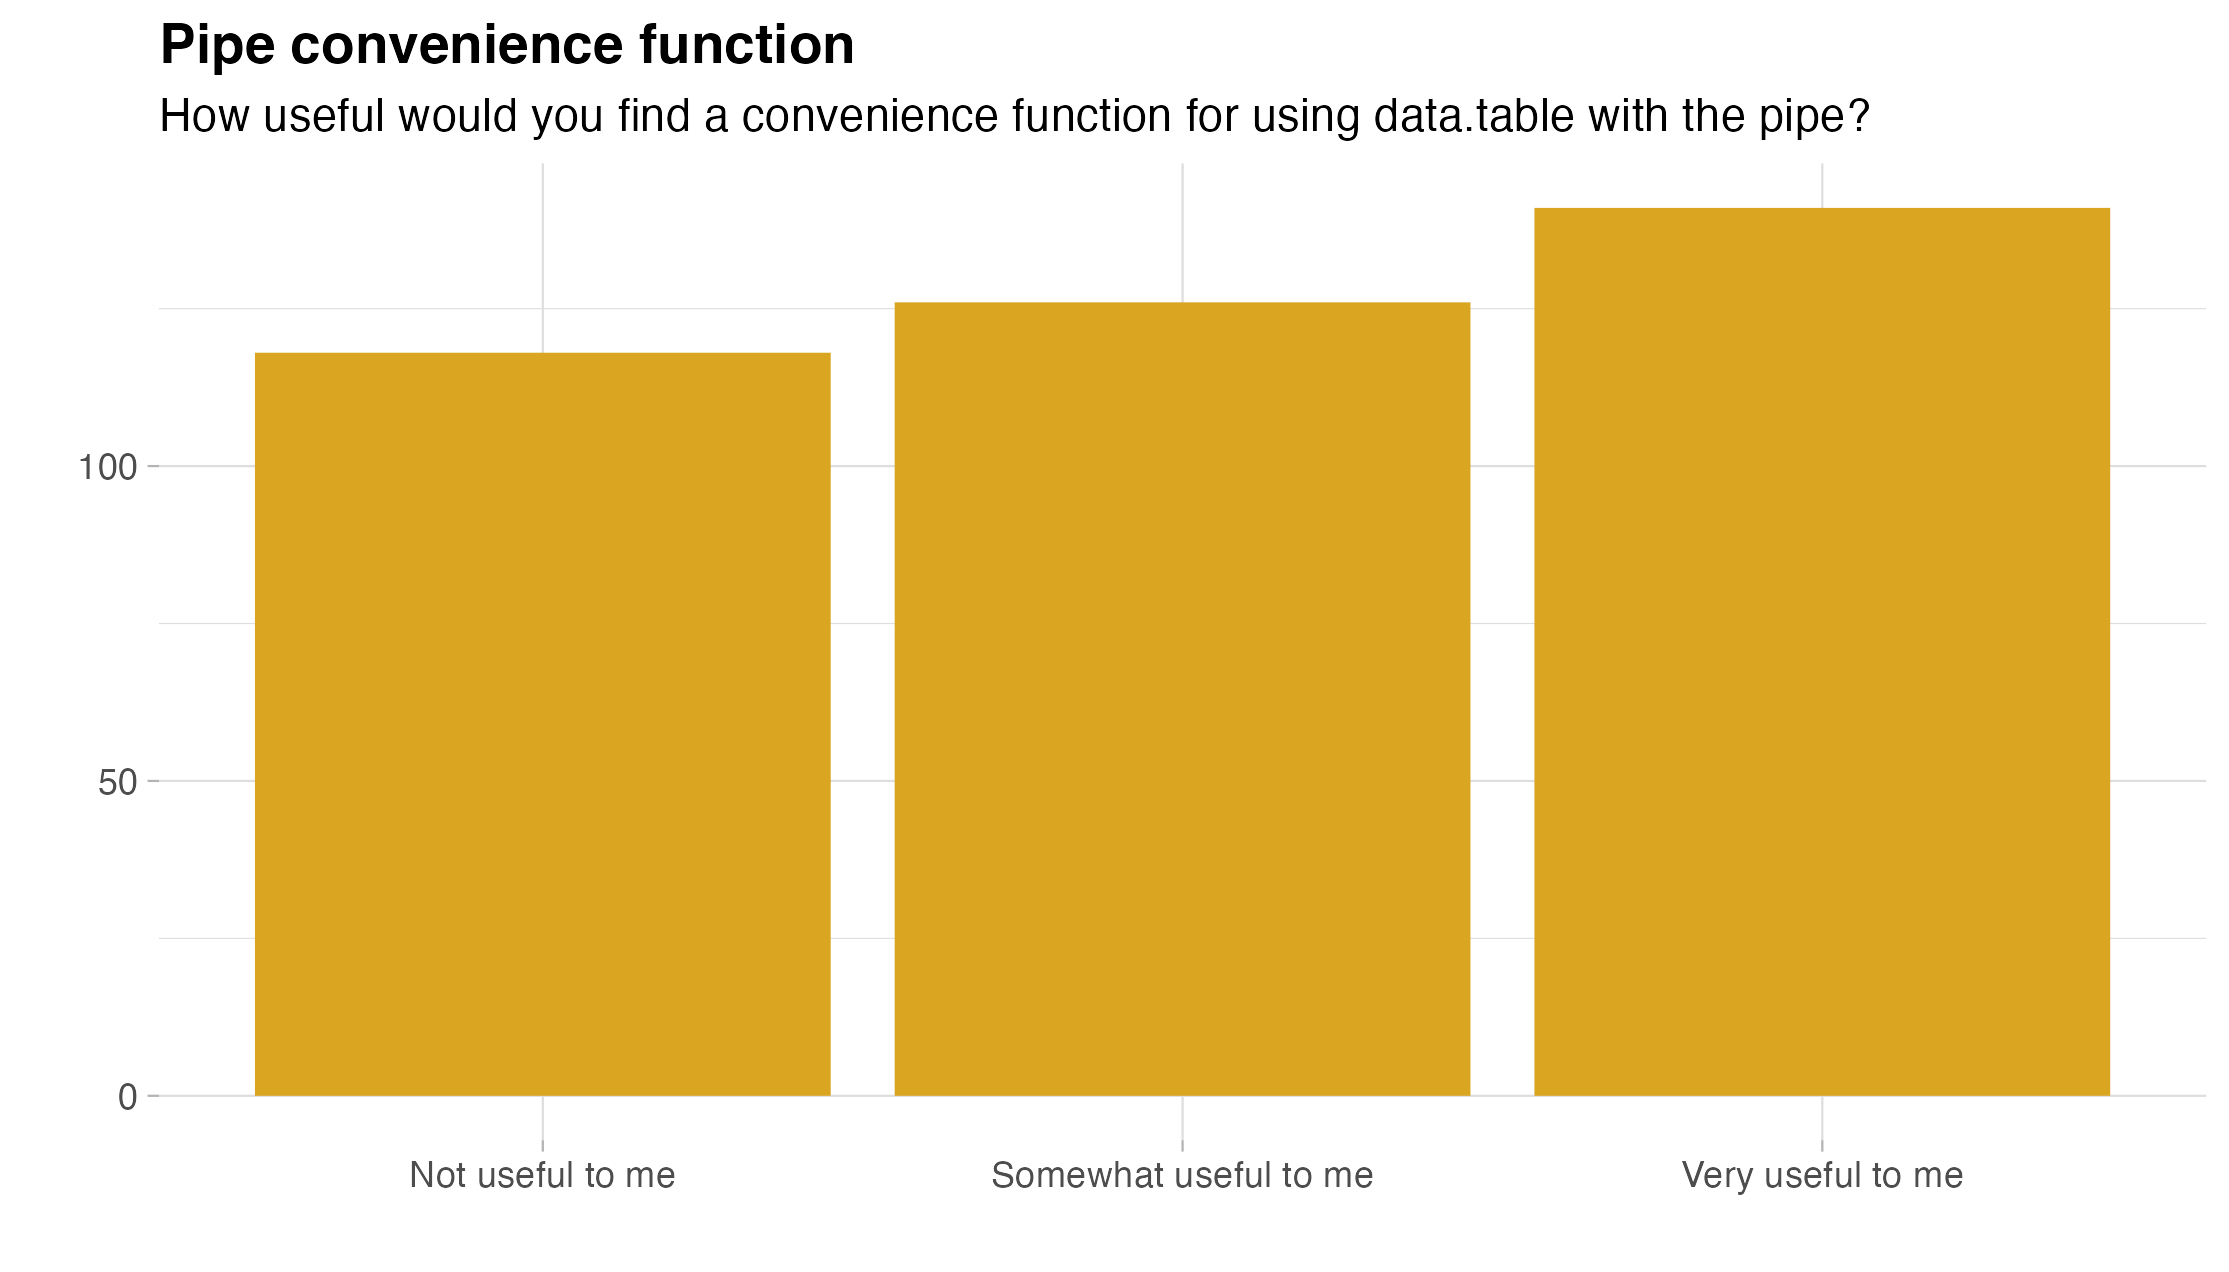
- integration with the pipe operator.
Pipe integration was also the subject of a later question in the survey, with the majority of users (69.4%) indicating they would find a helper function for working with the pipe useful.
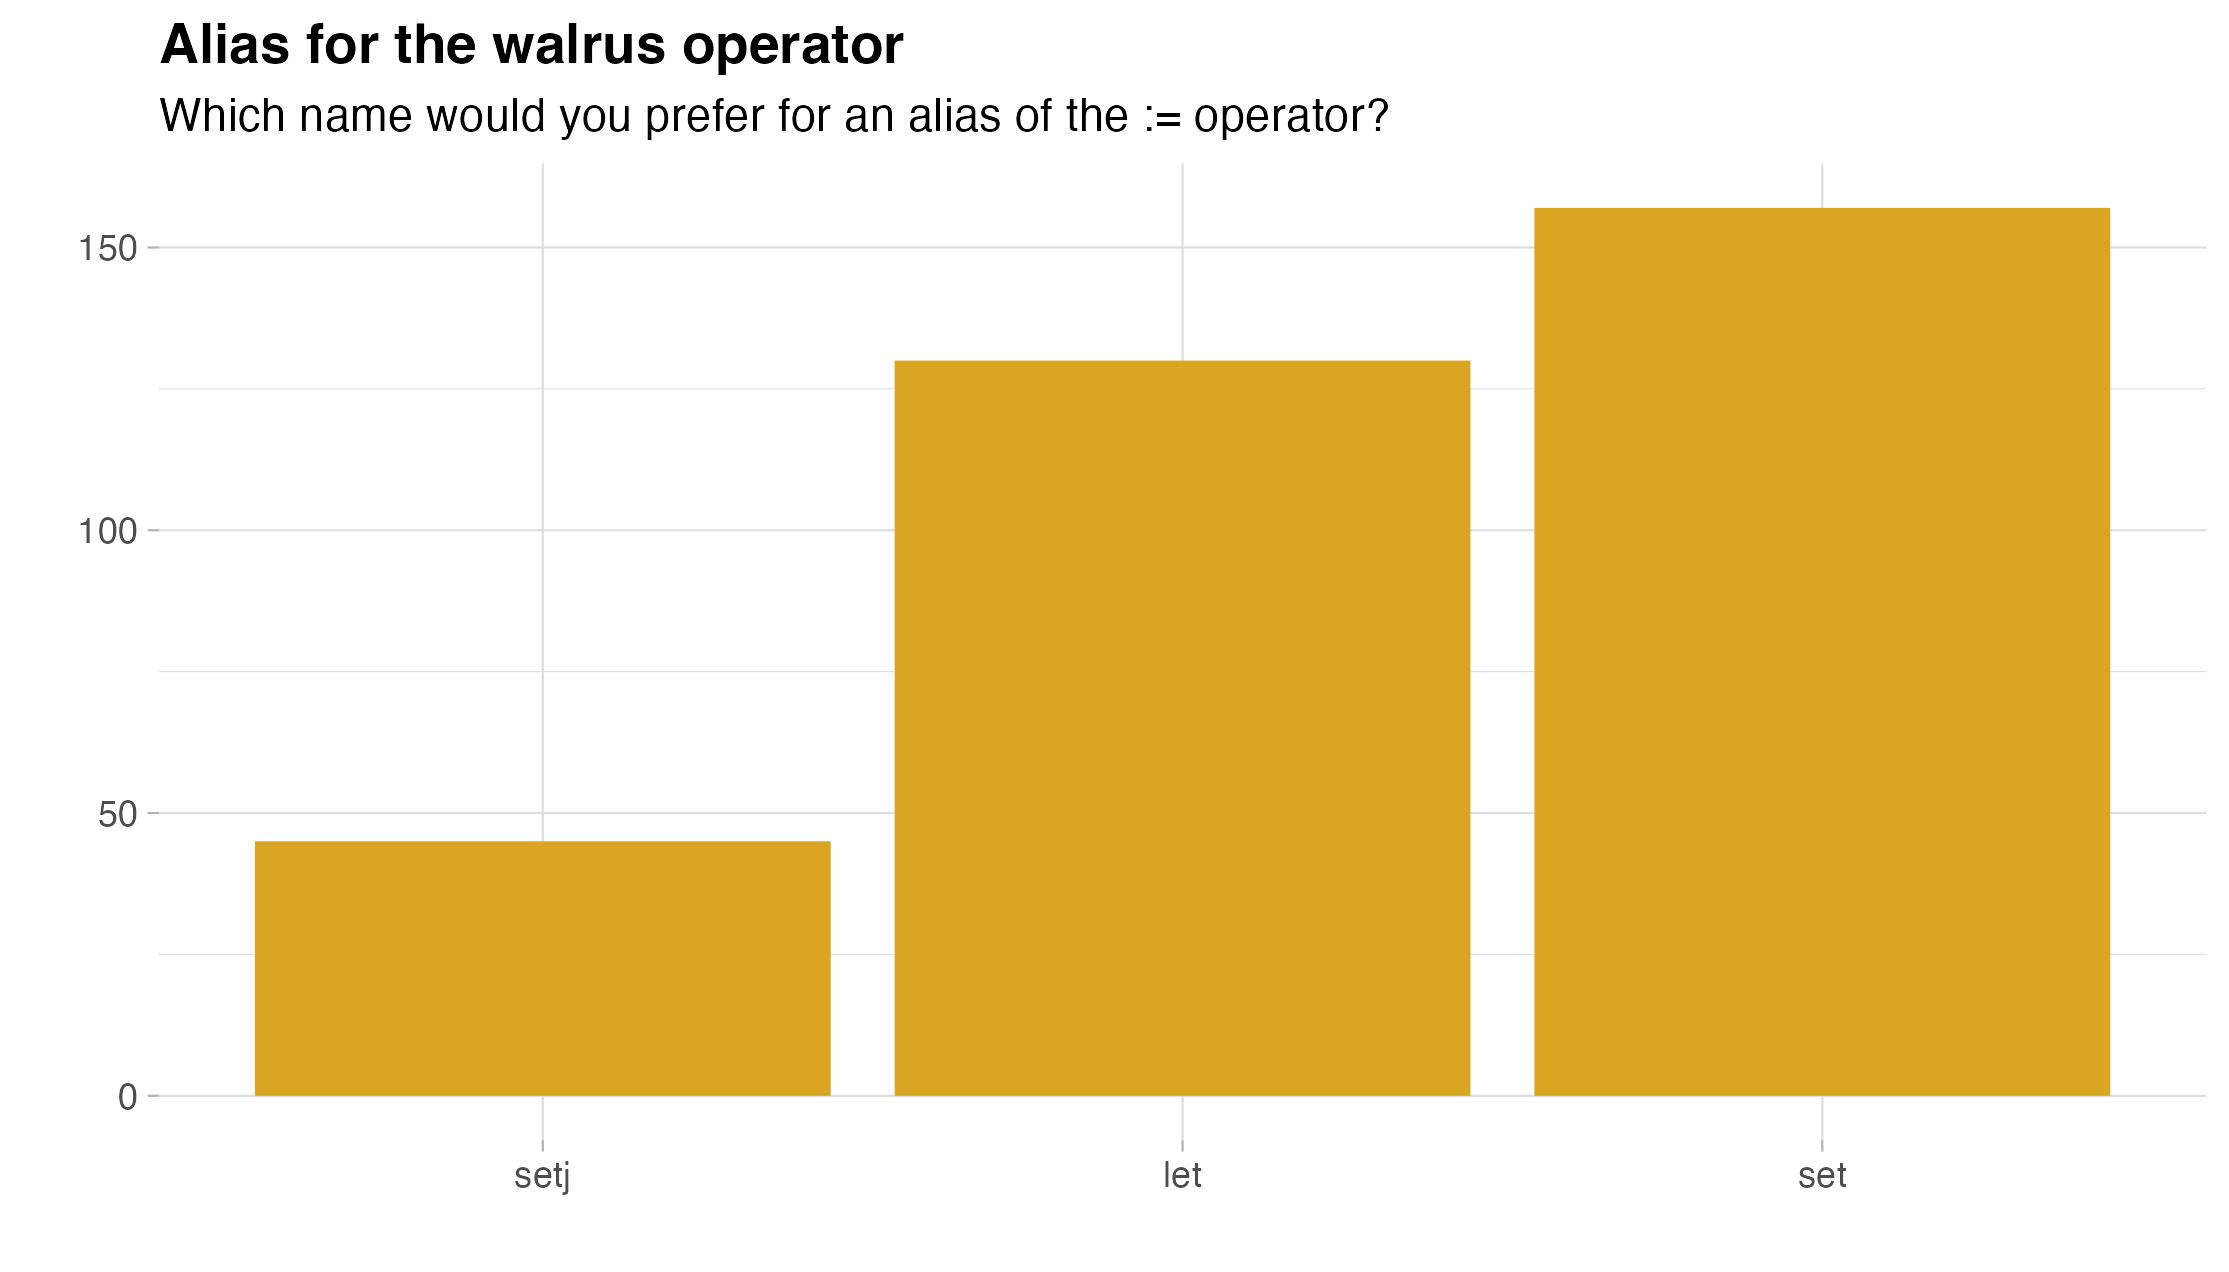
 Another specific question asked about the alias for the walrus operator (
:=). Interestingly, set() (47.3%) outperformed let() (39.2%), with setj() (13.6%) far behind.
Contributing to data.table
Good news for data.table is that many users indicated interest in contributing to the project. In particular, 80 respondents (20.8%) said Yes, and a further 191 (49.6%) respondents answered Maybe.
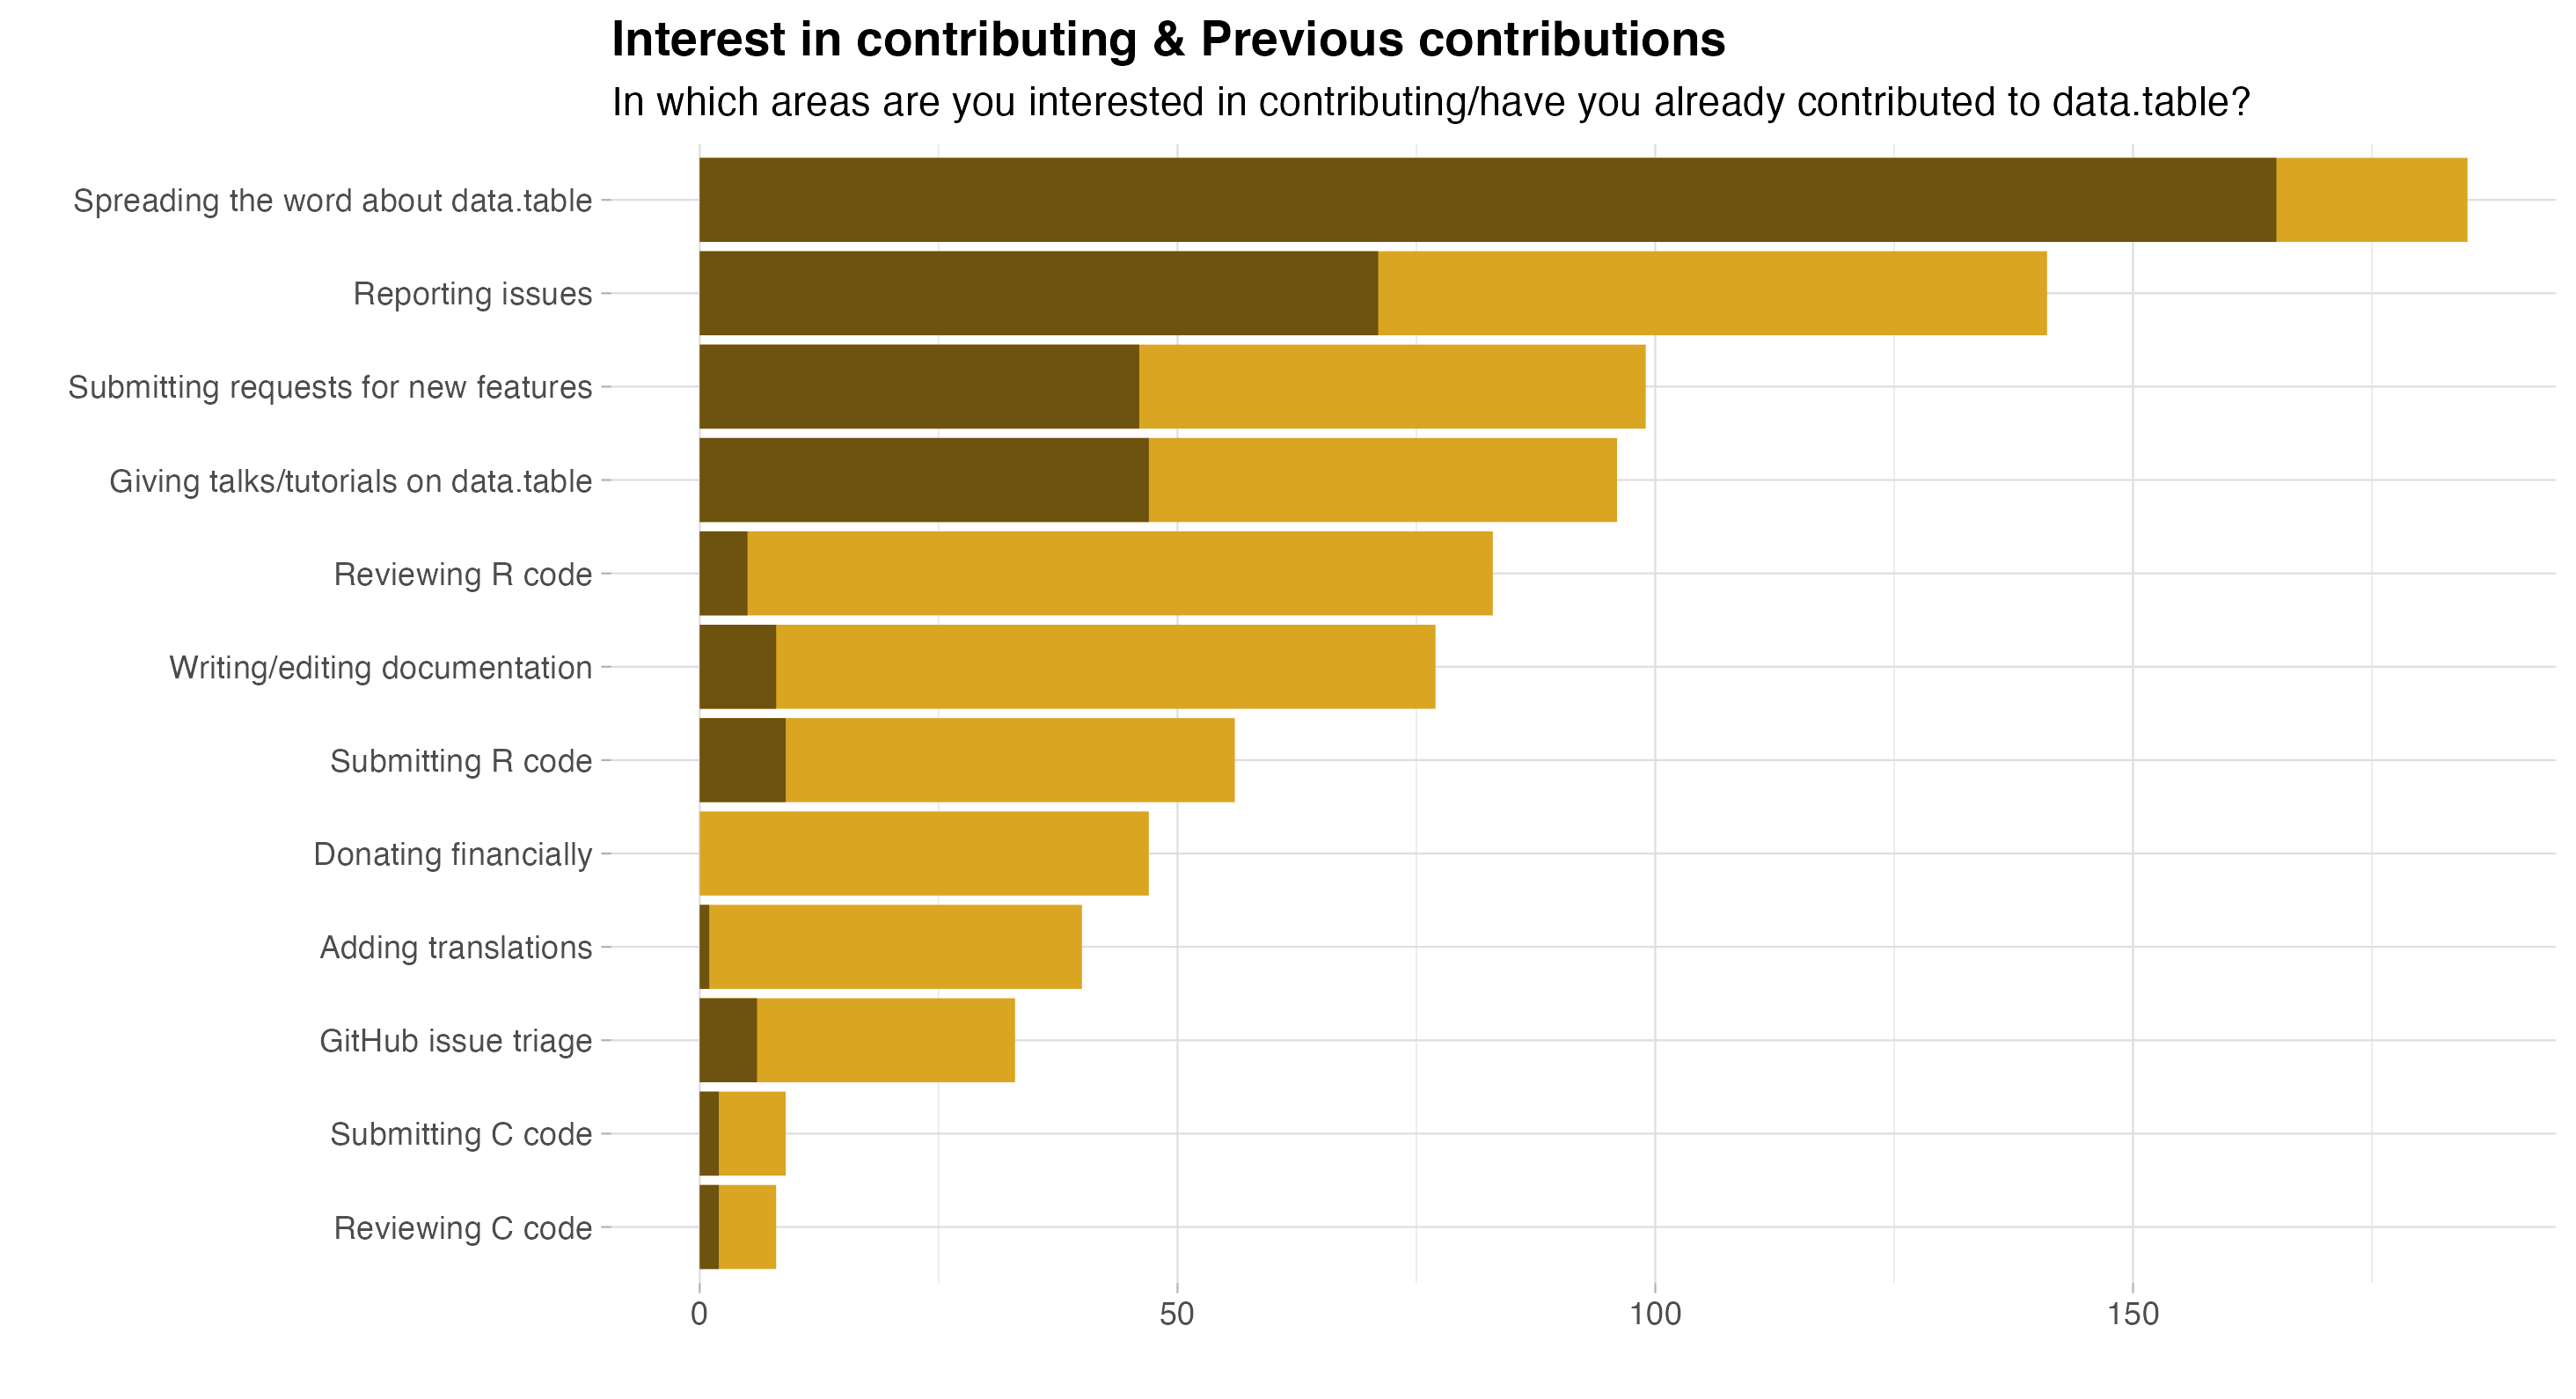
We followed up on this question by asking for interest in specific activities. The orange bars in the following plot represent interest in contributing, whereas the darker parts indicate actual contribution in the past.
What would make contributing to data.table easier or more appealing? Setting aside personal reasons, such as lack of time or skill, the following areas were mentioned at least a few times each:
Developer documentation. Probably the most common suggestion was documentation that would make it easier for new contributors to understand the codebase.
“Documentation explaining the code of data.table. I mean the big picture, choices made but also some details.”
GitHub issue & PR backlog. Shrinking the number of open GitHub issues and pull requests was another common suggestion.
“data.table has to many open issues to efficiently search for existing issues.”
“Getting rid of the current PR backlog would be a big step forward. I feel that a number of good PRs have died on the vine without good reason.”
Fast turnaround. A related suggestion was quicker reviews and evaluation of pull requests.
“Some PRs take forever to be approved so this is disheartening for someone to get involved”
Source code. A couple of users suggested that the source code could be restructured to make it easier to work with.
“Better structured code (right now the
[.data.tablefunction is more than 2000 LOC; very hard to read and modify!). More structured test suite (right now it is a single long file with numbered tests; adding more tests can be cumbersome).”
Conclusion
The responses to this survey make the value of data.table clear, but some users fear that the package may be abandoned or stagnating. Fear not, the project is again picking up steam! An important release with many new features and bug fixes recently landed on CRAN, and the project now has a governance document, which includes information on the different roles you can take. New contributions are very welcome, so check out the guidelines and take a look at the open issues - those labeled beginner-task are a particularly great place to start!
What can you do?
Are you interested in learning more, or helping grow the data.table community and infrastructure? Here are some places to start:
Submit a blog post to The Raft with your ideas, insights, or use cases of
data.table.Weigh in on issues and community discussions at the
data.tablegithub page.Contribute to beginner task updates or documentation needs for the package.
Apply for the data.table travel award to give a talk at a conference.
Email r.data.table@gmail.com to reach the NSF Grant steering committee with your thoughts and ideas.